DOW went down 120 points, so that's a big correction for US side. This will spill over to STI and HSI respectively. It did, in the morning, STI was down like 40 points and I guess it recovered somewhat to close at negative 20 points, not too bad right? HSI down another 380 points, after yesterday's negative 120 plus.
Let's look at both the charts
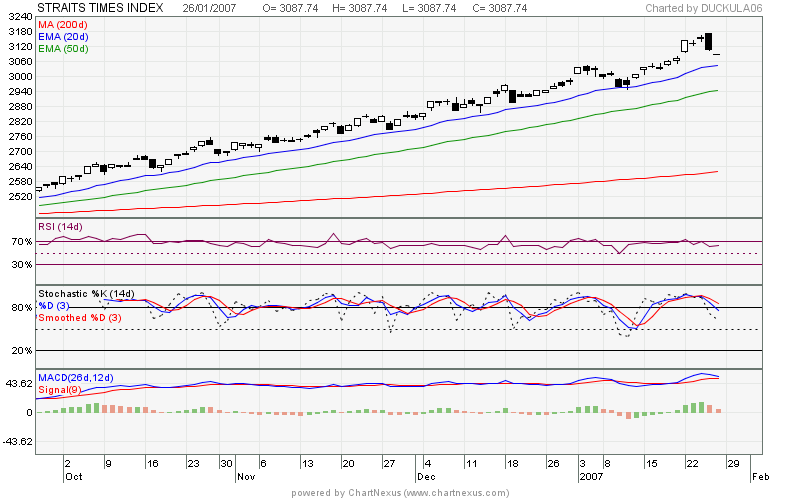
STI under going some correction for now. Looks like more downside to come. I think it might use ema20 days as a moving support, so it shouldn't go below the blue line. If it does, the next one to look at is the ema50 days. I don't think it likely to go below ema20 days, because overall it's still bullish. Stochastis %K line slowing down, could be seeing downside with less magnitude. Perhaps middle of next week we can see a resumed uptrend again. It's good to see some correction, if it doesn't go down, it won't go up further.
HSI doesn't look too good for short term. The blue line is the ema14 days for hsi. We can see that today it plunges all the way down to touch ema14 days. Monday, no doubt will be another downday. We can see it from the stochastics chart. It just began going on its downtrend, so we won't see a reversal soon. Perhaps end of next week? If RSI drops below 50%, then the downtrend will continue eevn more. Seems like 50% RSI is the support line. We'll see if it test this 50% mark and rebounces. If not, prepare for more downside. Overall still bullish. HSI is at a crossroad now, if anytime it head upwards before it goes lower than 19,700, HSI is still bullish. If it goes below 19,700, then we have to look at the next peak - does it cross over 20,700 like that. Basically, look out for lower peaks and lower lows to confirm downtrend.
Using macD indicator screening, here's a few stocks that are worth a shot:
1. CNA group
2. Penguin
3. Japanland
4. SeeHS
In my opinion, JapanLand and SeeHS stands a good chance. Why? Both RSI are above 50%, so still bullish. Both weekly charts look excellent too.
Let's run a trial to see if I'm right:
Japanland:
Price now: 0.090
Resistance: 0.095, 0.110
Support: 0.075
SeeHS:
Price now: 0.460
Resistance: 0.485, next resistance at 0.530
Support: 0.430, 0.365
Alright enough of homework. TR for the week: nearly 10k losses. This due to longcheer reaching 1.14. I made 140 plus from warrants trading this week.


0 comments :
Post a Comment