I wrote a article about the different seasons using the MACD (moving average convergence divergence) indicator here. In it, I talked about how the four seasons can be characterised objectively by looking at the slope and the positivity/negativity of the histogram. Let's see if we can replicate that into another indicator - the moving average.
There are a few kinds of moving average, and usually I'm using exponential moving average (EMA) because they are more sensitive to the latest price movement. Moving average should be drawn in a pair, one shorter and one longer term with the longer one being twice that of the shorter one. That means if you use 10 days MA, you should include 20 days MA as the longer term line. It doesn't really matter which days you're using, it could be 50/100, or 100/200, but for the purpose of this article, I'm using my 13/26 days EMA. 13 days EMA is my short term line and 26 days EMA is my longer term line, unless otherwise stated.
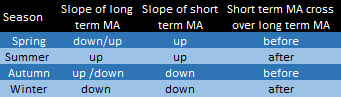
Here's the matrix:
Different stocks are like different countries in different hemispheres. Some are freezing in deep winter while others are sweating in hot summer. Some have longer summer and shorter winters, while others have longer winters and shorter summers.
Let's have a look at the different index:
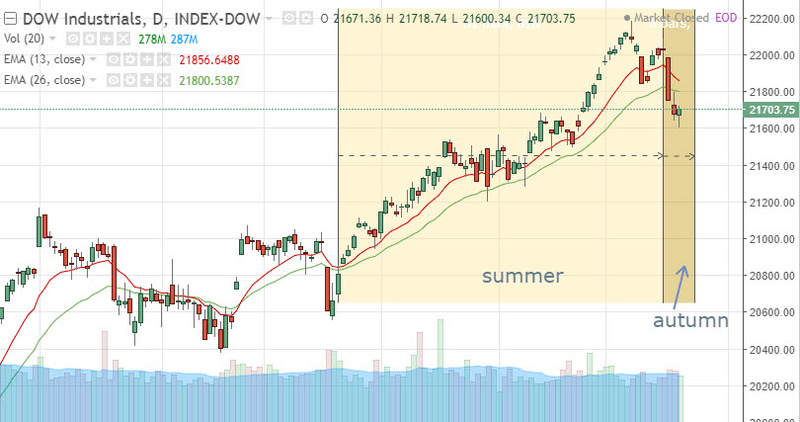
DJI : after a prolonged summer, it's autumn now
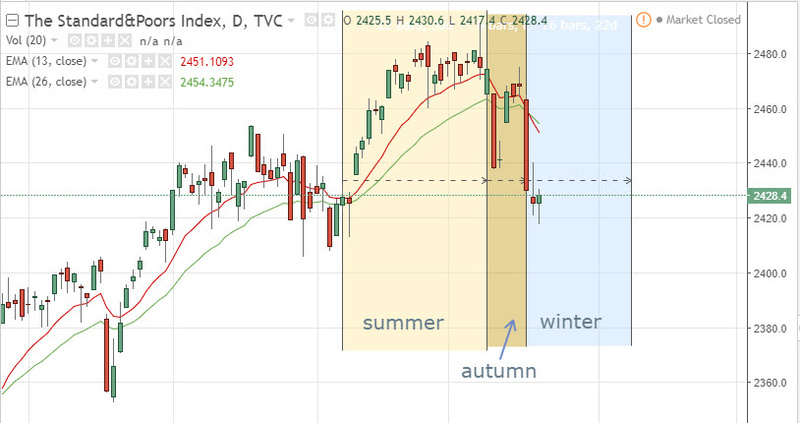
S&P: autumn had given way to winter. The first snow just fell a few days ago.
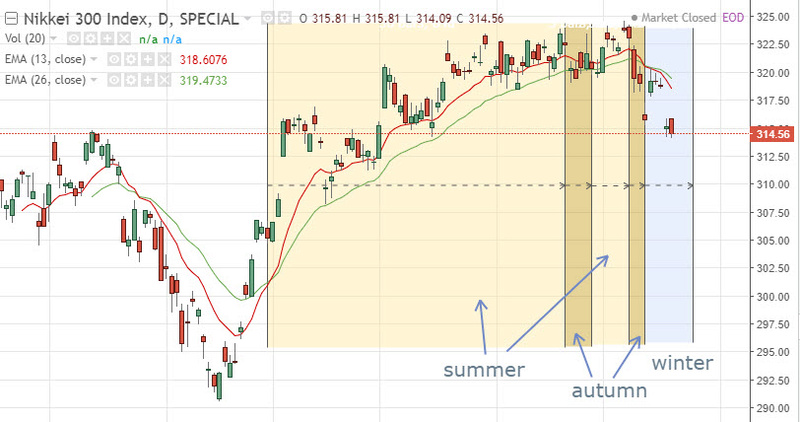
Nikkei: strange weather phenomenon. Very long summer, a fake autumn, another shorter summer and a brief autumn, bringing us to winter now
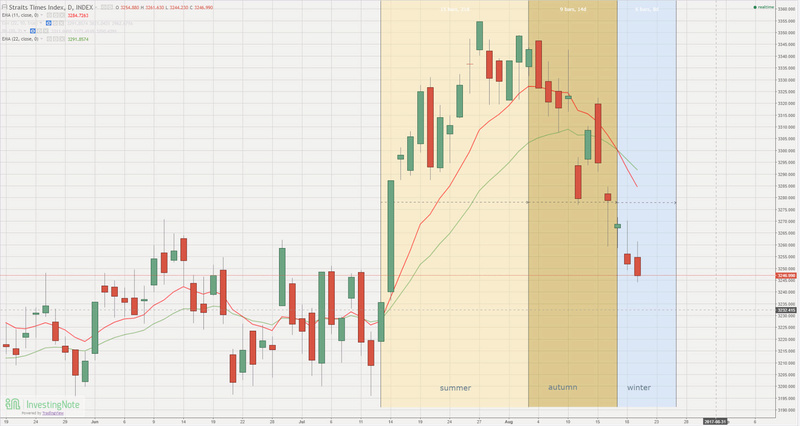
STI: winter is coming (or had already come).
This is neither a rally to buy or to sell, it's simply weather reporting. I'm not even forecasting. Doesn't matter whether it's summer or winter, we just make sure we fatten ourselves during summer to prepare for winter, and do the necessary prep work to plant the seeds just when the last snow falls to prepare for the bright sunlight during summer.
There are a few kinds of moving average, and usually I'm using exponential moving average (EMA) because they are more sensitive to the latest price movement. Moving average should be drawn in a pair, one shorter and one longer term with the longer one being twice that of the shorter one. That means if you use 10 days MA, you should include 20 days MA as the longer term line. It doesn't really matter which days you're using, it could be 50/100, or 100/200, but for the purpose of this article, I'm using my 13/26 days EMA. 13 days EMA is my short term line and 26 days EMA is my longer term line, unless otherwise stated.
Here's the matrix:
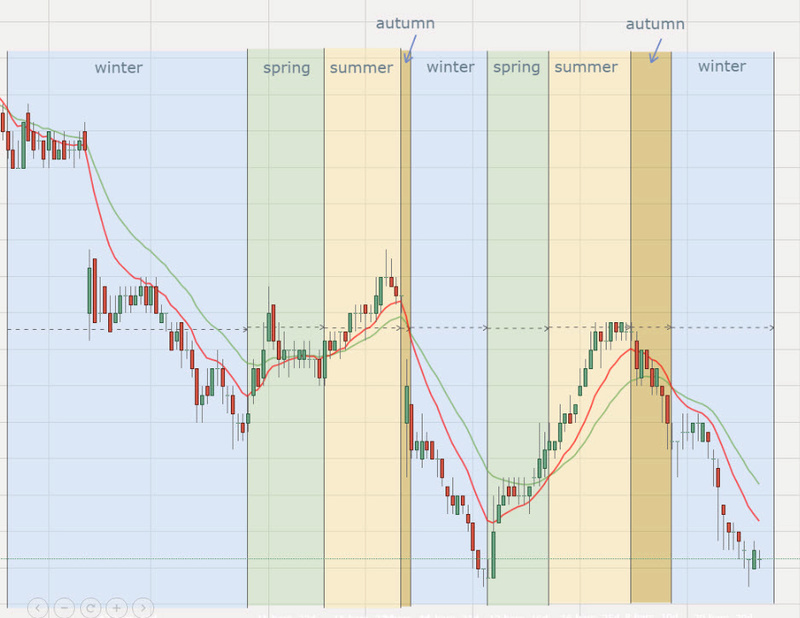
I'll illustrate with an example: Singpost
(The red line is the short term line - 11d EMA and the green line is the long term line - 22d EMA)
Let's have a look at the different index:
DJI : after a prolonged summer, it's autumn now
S&P: autumn had given way to winter. The first snow just fell a few days ago.
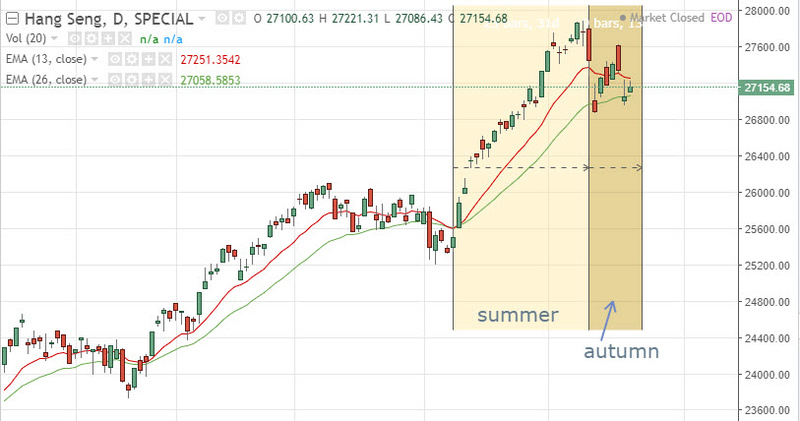
HSI: It's still bright and sunny, but to the observant ones, some of the leaves on the trees are turning brown and starting to fall
STI: winter is coming (or had already come).
This is neither a rally to buy or to sell, it's simply weather reporting. I'm not even forecasting. Doesn't matter whether it's summer or winter, we just make sure we fatten ourselves during summer to prepare for winter, and do the necessary prep work to plant the seeds just when the last snow falls to prepare for the bright sunlight during summer.