Thursday, March 29, 2007

Dow -90, STI +27

What a wonderful day for worldwide market!

They totally ignored the pitiful pleas of Dow's -90 close last night and rallied strongly. Most went from very negative to positive, so that's the kind of bullish undertone we're talking about there.

Nikkei went from -200 something to +9, HSI went from -60 to +270, while STI went from -50 (i think) to +27. Amazing recovery by STI with not too bad vol too. Most stocks are down in the morning, but by afternoon not a lot of stocks are red.

Again, I'm just amazed by the strength and resilient of blue chips. Yes, it's damn expensive to own 1 share but look at one fine example, CDL. Whacked down hard to 14.1 today, but bounced right back to close even higher than yesterdays at 14.8. Capitaland reached 52-weeks high of 0.800 too, simple great! I won't buy so much of penny shares now, trust me, if it takes me 1 yr of losses to find out, I'll do it again.

As I predicted, my take for HSI is that it'll drop to 19500 support and hold, thereupon it'll rally up. It did exactly, to close 300 points up. A pity I didn't buy calls as I swore off warrants, but seriously this boosted my confidence in my chart reading.

Swiber rallied up 0.060 to close at 1.30, with intraday high of 1.34. I bought more swiber at 1.31 to bring up average buy price to 1.275, 10 lots. The charts formed today is very good, MACD going to cross over red line and with a bullish engulfing (very big white candle) candlestick. Tmr chances are very high that it'll break today's intraday high of 1.34. I again bought 2 bids above support level of 1.30 (so it's quite safe) since it broken free of resistance at 1.28. Next resistance to test is 1.34, thereafter is 1.28 then the all time high of 1.42.

Pac andes climb 0.060 today. That's the 5th consecutive days of climb, bring it up from 0.865 to 1.12, a whooping 30% increase within 5 days. I supposed shortist are targeting this stock already. I dare them. Still more upside to come, pending on macro issues. Stocks are like that, if they break all time high, chances are they will keep on climbing. Same thing if it breaks support, it'll keep on going down until it finds another support. Intraday high reached 1.15 even..I think this will continue to move up more.

Good news for US side. Their gdp figures estimate have been raised from 2.2 to 2.5, expected better performance. That ought to make people feel more at ease. Europe all gree, dow is now at +50. Look forward to a good closing tmr, at least the funds manager will make it look good for account closure for the quarter.

We'll see sti's true colours next week.

Wednesday, March 28, 2007

Pac andes on fire!

After dow's -70 closing last night, regional markets went down.

In my opinion, it wasn't down THAT much. HSI down 150 plus points, nikkei down 100 points, STI down 30 points. A few macro factors that may affect global markets. First to come to mind is the rising middle east tension. But come on, when is the last year you knew that middle east isn't in danger of war? Only this time is Iran. Some sailors from UK got captured, Iran refused to hand over them, blah blah. Due to this tension, oil price has been rising too. Last I heard, oil per barrel rose to US65. That's very close to last year's US70 per barrel. One interesting thing, today there's a rumor that Iran fired a missile at US or UK warships. That sent oil price to 68 US in minutes. Haha, did it really happen? Nobody knows.

Which sector to focus on? Probably oil stocks. The stock that come to my mind will be Wilmar, doing alternative fuel. Being aiming for this stock to drop, so that I can accumulate for long.

STI's uptrend still intact. Basically today's drop just removed all the gain we had yesterday. Now we're back to 3200. Target for downside is 3150. If it breaks, STI most likely will go below 3000. If 3150 holds, STI may well continue its climb where it left off at 3300. I'll probably get more good shares near 3150, but have to see if that level provides good support.

HSI already dropped to 19500 already, which I identified as the support level. From macro point of view, the situation isn't conducive for me to buy call for hsi at this point. I'll just forgo this. Charts don't look too nice too. At this kind of time, better be safe than sorry.

Oh, left a selling queue for my CDL warrants yesterday. Since I didn't recieve any sms that I sold my warrants, I assumed that I didn't. It's just a matter of luck that I actually read the trade notification that dbs always send to my email. Don't know why, felt like reading them today. THEN I SAW I HAD ACTUALLY SOLD IT! It'll be a disaster if I didn't notice that. I had half a mind to sell off my CDL warrants this morning on account of Dow's bad closing last night. Luckily I saw that I had already sold off yesterday, otherwise I'll be technically shorting the warrant. If I didn't cover and buy back on this same day, sgx will buy back for me. And who knows what is the price of the warrants + penalties for short selling?!

Granted, I didn't meet my target of 15% returns on this warrant, but it's a good thing I sold at high. Today the warrant dropped because the mother share dropped to 14.4 from 14.8. Broke resistance turned support at 14.6. On light volume though. Might see it return to 14.2 before can cheong, depending on macro factors.

Swiber dropped to the level that I bought, 1.24. It's a good thing I bought near support level, so at least it won't tank below the price I bought. Still bullish on this stock. I already paid fully for this already, so I'll hold this for some time.

Pac andes on fire now. Rallied up 0.080 to break all time high of 1.06. Intraday high is at 1.09, on high volumes. Since all resistance had been broken, we should continue to see spectacular moves on pac andes. According to charts, more more upside. I hope it'll come down a bit. Never too good to see stock rallied too fast. Let it come down, cool down the speculative fever (let it consolidate) so the stock can move further up for longer term. Excellent returns for this: 25% gain, excluding 3.7% dividend yield.

Learnt too many lessons this year. Actually investing in shares is the way to go, never warrants. I can get slower, steadier gains where I can sleep soundly every night with shares, not really with warrants. Too fast, too kelong already.

Dow -60 now.

Tuesday, March 27, 2007

Bullish engulfing on STI?

No charts today, too tired.

Swiber did well, broke 1.26 resistance and reached intraday high of 1.3 before closing above resistance at 1.27. Next resistance at 1.3, breach that we'll rock and roll.

One of the rare times that I saw STI being independent today. HSI and Nikkei dropped (although a little), STI is the only green market around this region. Good huh? And all this is on a down day for Dow. Perhaps rumors are flying around the market that Marina bay construction contract is going to be awarded soon. Yongnam, BBR and CSC flew with top volumes.

STI on the whole advanced by 30 points with rather respectable volumes. Candlestick reading shows a bullish engulfing, a good sign. I expect tmr STI to go up too, depending on how Dow perform (unless STI becomes independent again). Basically still have a gap at 3150 yet to be filled, but if it becomes breakaway gap, then no need to cover already. Next resistance for STI I'll be looking at 3300. Haha, if that really happens without STI covering gap, I think we'll be posed for a major crash later. Haha, who cares, enjoy while it lasts!

CDL rallied another 0.3 again, after 0.3 gain from yesterday. So that's 60 cts from this week to date. Impressive! Resistance at 14.6 taken out with high volume. Next resistance should be the 52 week high - 15.2. TA point of view: more upside to go. I'll be cashing in soon to lock in profit and wait for a bit of pull back and deciding whether to go in. Probably not, cos nowadays' i'm swearing off warrants, haha! The incline upwards is too steep already, increase until I'm scared. Let's try to make a 15% gain on this warrant, then I'll be a happy man :) That's just 2 bids away from current price.

Pac andes continued its marvellous climb. This stock should rocket throughout this week, excellent bullish signs from technicals. After General meeting, this stock should climb even more because then we'll have more details about the rights issue. Happy to be able to get 1-1 rights for pac andes at super big discount of 0.52, compared to today's market close of 0.98. That's nearly 50% discount, haha! I think after getting those shares, we can even sell the rights on market, so double whammy :) so exciting for pac andes development, to think i'll have to wait 1 WHOLE year for this. It's worth it.

Dow is at -50 now. Yesterday dow went as low as -100 before recovering to -11, another hit but won't die case. Let's see if tonight dow would repeat that performance.

Monday, March 26, 2007

Pac Andes is worth the wait

Today Pac andes did me proud!

I held that stock since last year April, when I started buying my second batch of stocks. I bought it because of a recommendation by DBS vickers and held it ever since. It didn't do well, but neither did it sink, more or less ignored by the market for the most of last year.

Because Pac andes is going to issue rights: 1 to 1 right to buy new shares of pac andes at 0.52, which is at a huge discount from today's closing price of 0.940, Pac andes was snapped up like crazy when market opened today. It went to an intraday high of $1 before receding to 0.940.


Overall looks good, with short term ema about to cross over longer term ema, and MACD cross over too. I identified 0.96 as the resistance level. Based on estimates from FA, this stock should rise be at least $1 since it's almost 70% of China fishery (and guess what, China fishery has excellent earnings growth rate, around 72% if i dun remember wrongly). One experienced forum user estimated it to be around $2.50. We'll see how this crazy stock can cheong this week.

CDL rallied again, jumping another 0.3 today to reach a intra day high of 14.7. With that, my CDL warrants had turned from -1.5k to +200 to 300. A big sigh of relief from me.

Based on charts, this mother of property stocks has more to go. Resistance at 14.6 had to be cleared convincingly. The increasing volume looks promising too. After all, CDL and a few other property counters (like capitaland, kepland) are hot sectors to focus on these few weeks. These are the stocks that propel STI to new heights. Once 14.6 is cleared, the next should be 14.8 then blast off to 15.2. Very tempted to cash in my profits after recovering from my losses, but I think I'll just wait a while more since the charts say so.


STI this week don't look too good. Firstly, there is a gap around 3150 that needs to be covered before we can go further up. 3140 thereabouts also happen to be the fibo retracement 38.2% target, so I guess that's about where STI might drop to. If it drops to there and rebound, bullish uptrend will still be intact. If it drops below 3050, I'll be worried. From the looks of it, unless there's another major news that rock the world, that seems remotely possible.

Swiber held steady around 1.23/1.24, which is around the price I bought at 1.24. Playing stocks is so much safer (and slower). I don't even have to worry about it when I'm not monitoring. Haha, such bliss.

Europe now is a mix of red and green. Dow's future is +4, which doesn't mean anything. We'll see how it closes tonight.

Friday, March 23, 2007

Stock picks from me and their price to accumulate

STI pulled back together with low volume after a run up for the whole week. Looks rather okay to me. STI bounced right back after hitting intraday of 3200, and closed at -13 points.

Even thought STI puts warrants went up today, so I could actually sell to cut my losses tighter, I still think it's a good thing I sold off ysterday. This is because when I don't this losing warrants, my mind thinks clearer. Psychological trading is important, not just portfolio management.

I read through some charts and decided that this are some good stocks that had weathered good times and bad. Very fundamentally excellent stocks.

Wilmar F34 - I'm just waiting for 2.45 to reach, also fibbo 38.2% retracement target. This is going downhill for short term. Will pick up near bottom.

Cosco F83 - This is one hell of a stock I want to have. So many contracts won since last year, I think enough to last them till next year already. Waiting for 2.82 to accumulate.

Today I bought Swiber holdings. Charts is too good to ignore, so I bought small at 5 lots at today's closing of 1.24. MACD reached bottom already and going to turn positive. Broke out of resistance at 1.22. Today tested resistance again at intraday and bounced off to close at 1.24 on light volume. Excellent time to accumulate today. Next time is resistance at 1.30, which happens to be upper bound of bollinger band. Should reach target by next week and if it breaks 1.30, we should see it hitting 52 weeks high target of 1.42. Level that I bought should be quite safe because of resistance turned support at 1.22.


Interested in HSI? Looks bullish. So far I'm swearing off warrants, but if it's too nice and everything seems right, haha, sorry! Still will break the rule :) Waiting to enter call at 19,500 support level and that level will cover gap to clear the way forward.

(stupid pac andes still halt trading)

Total loss: 26.8k.

Thursday, March 22, 2007

Sold my STI puts, gng to be cautiously bullish

If you saw the DOW chart last night, you see something spectacular.

Around 215am singapore time, Ben was making his speech for the FED meeting. Dow spiked upwards sharply and never looked back. So what's new? Rates remained unchanged. But I guess people perceived that his language had softened in the sense that he might actually decrease the rates to help boost the economy somewhat.

Looks like my puts have to be sold, which I did today. Made losses and overall was happy. My CDL warrants surged up because the mother share rose 80 cts today. A few more cents my warrants would turn +ve, so pls do let that happen!

STI charts look set for another run. After breaking out of triangle convincingly, and shooting past resistance at 3150 (though with low vol), STI is heading towards next resistance at 3240.

RSI trending upwards and above 50% (bullish sign), MACD blue line cut red line and trending upwards, broke out of symmetrical triangle on the upside, broke resistance level...it's suicidal to hold puts unless you're having contrarian view. STI is sitting with the ema14 days about to cut ema20 days.

The only alarm bell in my mind is: LOW VOL!


Going up on low volume is not a good sign..not good at all. Let's be a careful bull here.

BTW, I'm going to TRY swearing off warrants for now. Until I've developed my system and portfolio management, I'll probably won't touch stocks for now. Need to close door and practise gongfu.

Pac andes still haven't announcement anything yet. It's really exciting to see what sort of goodies (or baddies) they are going to say. Suspenseful!

Based on my charting, CDL should hit resistance at 14.6. From the looks of it, it might break that target since some brokerage firm upgraded their take on CDL. Hmm, crossing my fingers here. Longcheer might hit 0.8 (next resistance) before reversing. Might be reversing already because today seems to be running out of steam.

Dow is now at -5.

Wednesday, March 21, 2007

Reflection for today

I didn't post for the couple of days because I'm too busy. Haven't been trading anything because of the situation we have over here.

Looking at STI, it shows quite a number of conflicting signals - signs that markets are not sure of where to go. STI exhibit a symmetrical triangle, which by itself is not bearish nor bullish - it depends on where STI breaks out, is it on the upside or downside. Today, it seems like STI had broken out of that triangle and is touching the resistance level at 3150.

To me, that level is important as I've covered earlier in my postings - it's both a covering of the gap as well as the support and resistance level of recent highs/lows, which makes it significant. To break this resistance would signal to me that STI have turned bullish, till then, I can only assume that STI is bearish as of the last charting.


Stochastics seems to be range bound, neither going up nor down. RSI touching resistance level at 54. Again, a breakout of this level would signify change in trend. MACD black line touching red line - I've learnt through the hard way that it's better to wait till it truly cuts it to conclude anything. Volume is worrying as it's steadily decreasing as STI recovers, certainly not a good sign. I guess all depends on US side now, with the FED meeting on going for 2 days. Might hear something from Ben to smooth the market, who knows? Maybe inflation is getting serious (it is GETTING serious), so might hint on postponing rate hike.

Seriously, I don't admire his job. Raise rates - economic goes into recession quicker as everything is quite bad. Lower rates - inflation becomes worse, economic also goes into recession. Most likely he will do doing and wait for more information.

Today made some quickie on HSI puts. $70 in 1 hour, not too bad lah. This is actually a bad move though, on hindsight. I risked too much to get too little returns. I shouldn't have bought anything today, it's just too risky. It's a good thing (and fortunate thing too) to have sold at intraday's high before the HSI surged up after lunch. DAMN LUCKY...

Longcheer rallied up 11%. Don't know what happened. At high volume somemore..hmm...

PacAndes on trading halt, pending announcement on major transaction. Don't know what is this, I hope it's good news though. Good fundamental stock which I've kept since I first started trading.

Dow is now +5, let's see how it fares later.

I have a sinking feeling I have to cut my puts for STI tmr.

Sunday, March 18, 2007

As in heaven... as on earth - signs in the sky

There's so much uncertainty in the market nowadays. STI is making bigger and bigger swings daily ranging from 20 to 100 per day, something that I haven't seen before. The best thing to do now is really to stay on the sidelines to wait for direction before plunging in.

The big question here: is the correction really over, or has it just begun?

Nothing can tell the answer. If you ask me, based on the charts, STI has more room to go down. I'm quite bearish and I do have put warrants on STI, so do take my point with a slight dose of skepticism. STI made a low high already, all we need is a lower low to establish the downtrend. It's hard to say.

People are raving over astrological predictions on stockmarket. Do take this with an open mind, don't dismiss things that you can't rationalise. The recent ones I've heard is that tmr (I think) has got a solar eclipse and since it near another lunar eclipse, historical records shows this kind of astrological charts signal a crash, as shown in the past. Can we project the past into the future? Well, sometimes we can.

The ones I do believe is Bradley turn dates. It's days where certain planets are aligned and it does correlate well to market turning points. There's no way to see if the market turns up or down, so that's the catch. The most recent ones was on 10th March this year. STI was near it's high after rebounding to around 3190 and it fell 130 points within 4 days around 10th march.

Want to know the next one? It's on March 20th, Tuesday.

China raised its interest rate to curb its very hot economic growth, so HK/China stocks should see some reaction. Maybe it might have been factored in already, seeing the drop last week. Bad economic news for US persist and that's the more important macro economic issue we should be concerned about.

Dow is down 50 points last Fri. We'll see if tmr STI can stand firmly on its feet.

Thursday, March 15, 2007

-120 to +50

Rude shock that I got today.

I monitored Dow yesterday night and was quite happy to see it drop to a low of -120. But before I know it, it opens at +50. As a result, market worldwide experienced a sort of rebound after yesterday's big selloff.

However, today's rebound is quite low in volume. If it goes up with low volume, it's an indication that a reversal is in sight. If it goes down, it doesn't have to be low volume, remember that! Dow's close tonight will be crucial to see how market will react. PPI figure for US is 1.3% higher than forecasted, so that's bad news.

It doesn't seem to go down though. As of now, Dow is at 22 points.

Today is called the witching day also. That's where the futures and options contract expiry. Characteristic of witching day in US is that of high volatility. Inflation figure is high also, so US fed rate might not be cut as soon as investors think.

All in all, bad sentiments. Let's see how Dow performs.

Wednesday, March 14, 2007

Puts puts puts, wait for what?

I've been waiting for this.

Okay, granted that the last few days of rebound (read: with low vol) almost wiped off the bearishness from my face. But last night, when Dow closed a mega -245 points due to its prime mortgage loans thingy, I'm on board the bearish train again.

First thing in the morning that I do is to buy STI puts. I wanted to get HSI puts but since I won't be monitoring actively for the whole day, I thought it's too risky and so I didn't. That broke 2 rules of my trading:

1. Don't buy in the morning immediately after market opens. I'm talking about 0900 to 0910 that period.

2. Don't change your bid after you key in.

Okay fine. I did break both rules and bought my sti puts higher than what I thought after it closed. I'm like 3 bids away from breaking even, damn. I think tmr should do the trick and make my sti puts turn positive.

Looking at the charts for STI, after we covered the gap around 3200, we tanked down today to close at -100. It turns out that all the indicators are fake rebounds, a bear trap that I described much earlier. We have quite a lot of room to go down from here. My target for STI is AT LEAST to the level of 2930, which is around the level of the last low. It's likely to touch 2960 (ema100 days) and rebound from there, though I doubt it. OCBC analyst are talking about STI reaching as low as 2700 to 2800 points (if that's the case, wonderful!)


Just in case you're wondering which puts for STI I bought. It's the one with strike level at 3000. Quite safe if you ask me, since we're now at 3053 points. I don't intend to cash out my warrants, just bought it for the capital gain, so yup.

HSI also quite powerful. Tanked down nearly 500 points today. If I'm a bit free, I might consider getting some puts for this index as well. If I can't monitor it intraday, I'd rather forgo the huge earnings (the warrants for this can go 50% up/down) because of its volatility. Can huat big or die big. Play safe.

Good thing about my portfolio is that it didn't tanked down as much. Acceptable lah. To focus on the long term, it's better for STI to bottom out completely. Have a complete selldown, totally, then we can focus on reaching 4000 points towards the latter half of the year. Europe market dropping from 1.5% to 2.5%, quite huge. Let's see how Dow opens in half an hour. Dow futures stand at -44, with General motors expected to give lower than expected earnings. Looks like another down dow day :)

----------------
Guys, keep up the comments!! It's lonely here!

Tuesday, March 13, 2007

Steady, it's still intact

STI down 23 points, HSI down 100 points.

I just checked the charts for HSI, looks pretty okay still, uptrend recovery is still quite intact. Actually, STI too. Basically I'd like to believe that the recovery is still on the way, today is just a shakeoff from 5 or 6 days of up days.

It's actually Dow that I'm worried about. Dow is rather weak these days. With a slew of economic data that are not in favour to a bullish sentiment, I think Dow could hinder or at least affect our recovery. When US sneezes, asia will also catch a cold. The bugbear for US is their housing/mortgage thing. I never really read what's the big fuss is their problem, I just want to care about how this can affect us.

I'll be busy this week (it's the March holiday for school), so might not be able to trade as often as I like. Might not be such a bad thing too, good for me to take a break.

I don't know why yellow pages rallied up so much today. Nearly added 10 cts, which is like an 8% increase. Considering that yellow pages usual movement of the day is 1 cts/2cts, this is really a lot. I scanned through the sgx announcement website but there's nothing regarding yellow page. Must be people knowing something that I don't? Or people are going for defensive stocks which yield good dividend? Hmm, I can't tell.

Either way, good for me. Good trading tmr! Dow -65 now. Europe a sea of red.

Monday, March 12, 2007

Bearishness almost wiped out....almost

Sorry for not posting these few days, been a bit busy going here and there with the IT fair.

Haha, first rule of the market, don't argue with the market. It doesn't matter what you think or I think, the market will have its own opinion. Seems like these few days of rebound wiped the bearishness in me. As someone told me, this rebound is like a basketball rebounding after hitting the ground - it missed your hands and hits straight to your face. OUCH!

Here's a couple of graphs - they look astonishingly similar.


Firstly, it's my favourite index - HSI. HSI recovery is quite stable, a series of higher highs and higher low, a rather clasic peak and trough kind of movement. Judging from stochastics, RSI and MACD, it seems like there's a lot of room to move upwards. Stochastics had already turned northwards with red line leading blue line. RSI is steadily trending upwards, although it's still not above the bullish 50% mark. MACD looks great, going to trend upwards - though it might easily turn down again. Moving average line looks great - had finished it's minimum curve and going to turn upwards. Price is around 19,400 - my level to cover the gap as well as resistance level. If tmr the price shoots upwards still, my bearishness for HSI is truly over and i'll turn bullish.


Next, STI. STI looks funny. This is a V-rebound, theoretically high chance of failure. But from the looks of it, it seems like we might pull off it. Moving average had already turned northwards, with price cutting above both average - WOW! The rest of the indicators exhibit the same signals as HSI. BUY BUY BUY! 5th day of straight rebounds - powerful recovery huh? My target for STI is around 3250 - the level of the gap as well as resistance level. It's just another 50 to 60 more points to go :) I'll still be cautious on STI.


City development CDL. If you've seen charts of STI and HSI, you've seen it all. I bought the warrants for this way back and it seems like these few days, as CDL is recovering, the warrants prices became active again. Just last few weeks, I advised someone just starting on stocks to go easy on pennies. Yes, it's cheap, yes, the rewards to multifold your earnings are there and yes, big caps are very expensive. But really, look at this, big caps are the first to recover from crashes and the last to fall. You can't achieve this kind of stabilities with stocks worth a few cents. I like this property giant, as much as capitaland. I'm going to get my hands on BIG CAPS from now on. Not more kachang putik stocks. Target for CDL, 14.1. That should be able to turn my now red warrants back to green, or at least narrow my losses.

BTW, daylight savings for US is over, so US side will start trading at 930pm and close at 430 am, our time. Europe side a sea of red - god knows why. Dow trading at -20 now. All the good sentiment is pending on US close tonight. If Dow pulls another +200 or -200, we'll go along. STI really no head chicken, always following others.

My close for today - losses at 26.1 k. Last week's tally: earned 860, lost 360, overall still gain 500. Yes, I know, still long way from my 26.1 k losses, but every little thing helps :)

Thursday, March 08, 2007

Not today

Not today.

Today we see a splendid rebound. At first in the morning, it was lackluster everwhere, with HSI and STI trending up and down. Basically there is a lack of direction because dow close -15 last night. It didn't rally, yet it didn't crash.

Around afternoon, nikkei starts to cheong. I do not know the reason why it suddenly shot up +325 points. With that, HSI start to rally up too, finally closing at +256. STI also went up to close at +63.

This isn't something to be happy about. Why do I say that? There is volume divergence. In bullish market, when stock market rallys, it will be accompanied by rising volume and lower volume when it corrects. When this fails to happen, volume divergence is said to have occurred. Since volume is independent of price action, it is not easily manipulated and is thus seen to be quite a good forward indicator of things to come.

Look at STI. Rising index but downtrending volume. Volume divergence happened.


Look at HSI. Before the recovery, falling index is accompanied by falling volume. These few days during the recovery, it is accompanied by decreasing volume. Volume divergence too.


Due to this, I still have a rather bearish sentiment towards both HSI and STI. I was introduced to a put warrant issued by SG for STI, strike price at 3000, expiring at end of april. That might be a good warrant to play with for the immediate and next week.

HSI is coming closer to my target of 19400. Haha, if that happens, I'll whack puts for HSI.

A song by Avril Lavigne. Described what is happening to the stock market now, haha :)


---------------------------------------
Everybody nursing wounds ah? How come so quiet? haha :)

Wednesday, March 07, 2007

The calm before the storm?

Today we see a bear trap.

A bear trap is a fake rebound, tricking investors to think that the worst is over before plunging down, thus trapping more people at a high. It happened to HSI and it happened to STI. Tmr might see another selldown day, pending on dow jones.

HSI made a total reversal. Before market opens, puts are down by a lot. When market opens, calls are up as HSI climbs up to a high of +200. After lunch, it went down all the way to close at -140 and so puts went up. It's so volatile that even if you hit the right direction, you might also lose money. In the morning, I had a strong feeling to buy puts, so I bought small amounts. HSI proceeded to went up by a lot and I thought gone case already. But by afternoon my puts went up instead, a pleasant surprise. This is just pure luck that I made around 400 bucks today.

Overall, HSI didn't close +ve. A bad sign. It stands a good chance to reverse the downtrend but it didn't. This shows that the downtrend is very much in tact. Looking at MACD, it seems a little more downside is possible. RSI is still hovering below 50%, without any signs of uptrend, while stochastics is still trending down, if not trading sideways. Looks like HSI is consolidating. My plan is still there, if it hits 19400 (ema 100 days resistance) and rebounds down, I'll buy puts with possible target of 18500. That's quite a lot of meat to fall.


I thought today STI is quite strong after yesterday's strong rebound by dow of +150 points. It did went up +50 before closing at +22. Not a good sign either. A lot of stocks retreat from their intraday high, a sign of selling. STI now is hovering near ema50 days resistance, with possible downside to touch ema100 days resistance. Target is near 2950 like that. Quite a lot of meat to short too. Please don't be lured into believing that the worst is over. I believe that the beginning of worser times is about to come.


I'll begin to short the market with stocks that I have but cannot sell. Like longcheer. Esp longcheer. CDL warrants too.

Dow is +15 now.

Tuesday, March 06, 2007

Rebound

Today market worldwide made a U turn.

It's not just another rebound. It's a bit of mixed signal to me. First of all, market volume seems low, but it could be because people are cautious after a major selldown so they won't return in flocks when we're still in bullish phase. Another thing is that STI stayed far from ema100 days without even touching it. Today, we up another 54 points with strength (though low vol).

HSI also stayed cleared of ema200 days, when it opened at +300 points and closed +400 points. Strong rebound. The charts also looked poised for a reversal in trend. But can't be sure yet. At least the immediate danger of falling below ema200 days for hsi is over. I'm looking at a rebound to a level around 19,400 for HSI. There's the ema100 days support turned resistance level. That's also the horizontal resistance line, so might be rather significant. I'll be looking for puts around that level if I didn't detect strength to break the resistance. If it did break that resistance, calls then. HSI is only 400 points short of that level. I think it depends on how dow performs tonight. Dow's future is around +100, so should at least have a good opening.

I made use of this rebound to sell of 1/3 of longcheer at a hefty loss of 48%. This is because I want to lighten up more load in case it tanked down again. I'm actually quite weary of today's rebound. Even though STI immediate danger of falling below ema100 days is over, I think this is just a technical rebound because of such a big fall on monday and the whole of last week. Could be a bear trap. Unless indicators show me that reversal is indeed due, I'll take it that intermediate trend is still down.

Europe market is mostly green. Dow opens +60 now. Too early to say how it'll close.

Monday, March 05, 2007

World market crash day...again

World wide crash day again.

HSI crashed 770 points while STI tanked down 140 points before recovering in the afternoon session to close at -90. This was followed by last fri's Dow which fell 120 points. Nikkei also didn't lose out, fell -575 points.

HSI broke 100days ema support. Dangerously near to 200 ema days support. If 200 days ema support also failed, it means that the long term trend for hsi has been broken, we can all say bye bye to HSI. I don't think it'll be broken that easily. I expect HSI to rebound upon touching ema200 days. But this rebound won't break the downtrend.


Today I bought two put warrants for HSI, sold within 1 hour and made 470 bucks. It's scary how fast my gains are realised. Today, if you anyhow whack puts for hsi, you could have gotten at most 50% returns. That's insane. I've never seen the ferocity of the bear attack. I'll remember this time forever.


STI also gone case. ema50 days broken, approaching ema100 days already. Intra day ema100 days had already been broken, it's just that it recovered, which can be taken as a good sign. Roughly, I think another 1 week more of selloff? I'm being optimistic here.

I realised all these indicators that I so depend upon are lagging. I must go and read up on those flag formations, triangle breakout etc. These are forward looking with a price objective too, so that I can expect what sort of price target for stocks. That's the homework I must do.

In the meantime, I'm looking at selling half of longcheer. Not decided yet. Dow's futures contract is down 90 points. Europe all down. We can only guess how bad Dow will end. If it's another 100 to 200 points drop, tmr I'll go puts for hsi again. HSI is at the fence now. If it breaks below ema200 days without strong rebound, I'll buy more puts. If touches then goes up, calls for me. Simple right? haha

Who has stocks which didn't kena the selldown? haha...from what i can see, all have red arrows pointing down. What a way to enter fiery pig year, haha!

Sunday, March 04, 2007

Charting on HSI and STI

Market outlook:

Dow fell another 120 points last Fri, so tmr's quite confirmed is another selldown. It's just a matter of how bad it is.

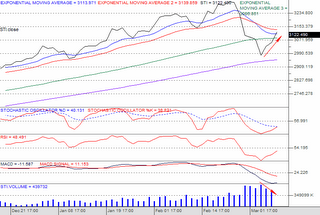
Looking at hsi charts, it only tells me one thing: There's more downside. The green line is ema100. From the chart, we can see that HSI had fallen below ema100 days, so the next thing to look at will be ema200 days. It's still early to tell if ema100 days will act as support, but from other oscillators, it doesn't seem like the end of the selldown. Stochastics is still trending down, with the red line about to make a U-turn. However, blue line is still trending down. Unless monday opens a strong recovery, the chart will still continue to trend down. RSI start to turn up but overall, still bad.

I might get puts.


STI has fallen below ema50 days. The purple line is ema100 days, which should act as support. Basically, I believe more downside based on ALL the indicators. Reading 'the edge' magazine, they said that there's a bearish flag forming with a downside target of around 2800 to 2900 points. That's a level we see around end of Nov last year. Scary huh?

The selldown is broadbased and is with heavier volumes. Do trade carefully.


My total losses now: 27.3k.

Thursday, March 01, 2007

Bad..

Today we see some rebound in the morning, however it was eaten by bears to close at -11 for sti.

Hmm...things start to look bad. Just had a look at dow, -200 as of now.

Nothing much to say today, wasn't even actively looking. If dow close again at -200 to -400, expect another bloodshed day for sti tmr.

KT, if you're reading this, don't sell now. Even if this is the start of a bearish turn, it will not go down one straight line. There's a time to exit, so sell when there's a relief rebound, unless your stop loss is triggered.

Good luck guys!