Showing posts with label Technical analysis. Show all posts

Tuesday, August 22, 2017

The 4 Seasons (part 2)

I wrote a article about the different seasons using the MACD (moving average convergence divergence) indicator here. In it, I talked about how the four seasons can be characterised objectively by looking at the slope and the positivity/negativity of the histogram. Let's see if we can replicate that into another indicator - the moving average.

There are a few kinds of moving average, and usually I'm using exponential moving average (EMA) because they are more sensitive to the latest price movement. Moving average should be drawn in a pair, one shorter and one longer term with the longer one being twice that of the shorter one. That means if you use 10 days MA, you should include 20 days MA as the longer term line. It doesn't really matter which days you're using, it could be 50/100, or 100/200, but for the purpose of this article, I'm using my 13/26 days EMA. 13 days EMA is my short term line and 26 days EMA is my longer term line, unless otherwise stated.

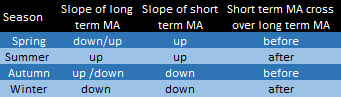
Here's the matrix:


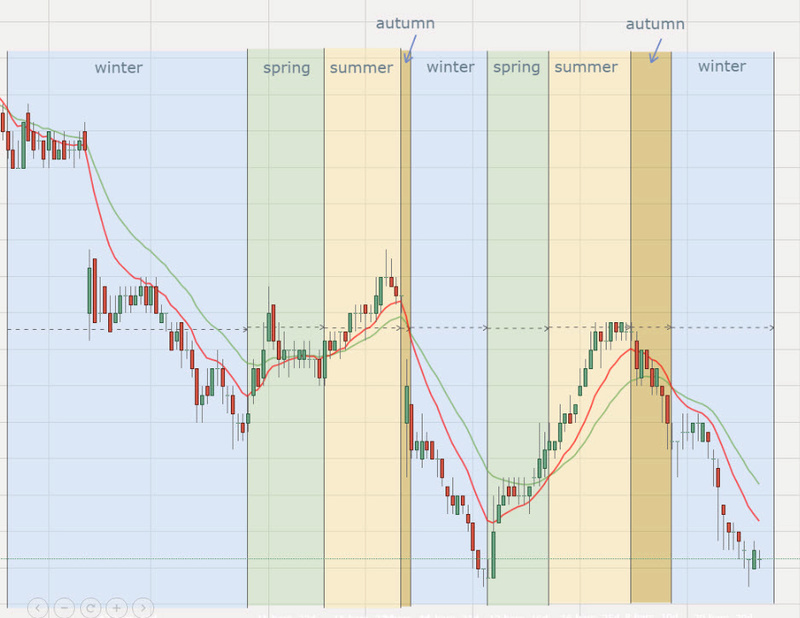
I'll illustrate with an example: Singpost
(The red line is the short term line - 11d EMA and the green line is the long term line - 22d EMA)


Different stocks are like different countries in different hemispheres. Some are freezing in deep winter while others are sweating in hot summer. Some have longer summer and shorter winters, while others have longer winters and shorter summers.

Let's have a look at the different index:

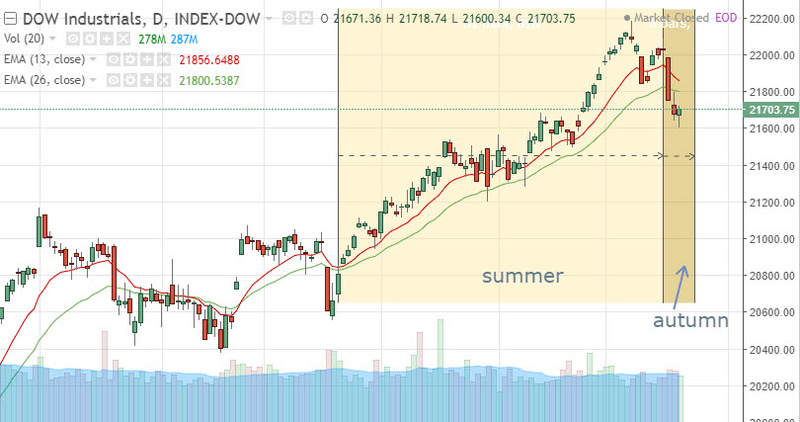
DJI : after a prolonged summer, it's autumn now


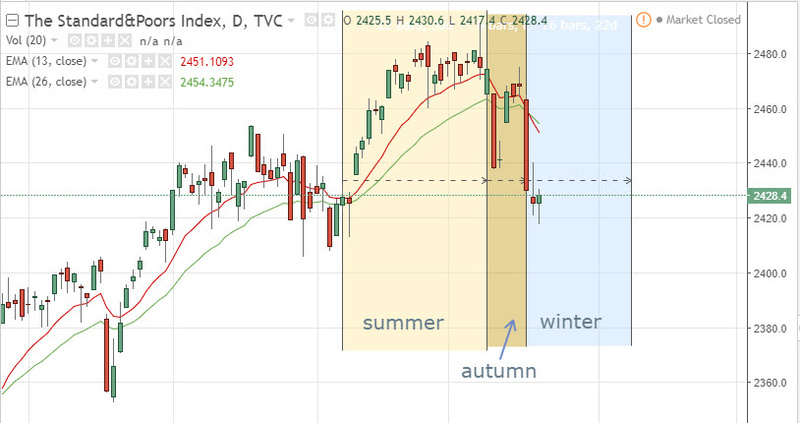
S&P: autumn had given way to winter. The first snow just fell a few days ago.


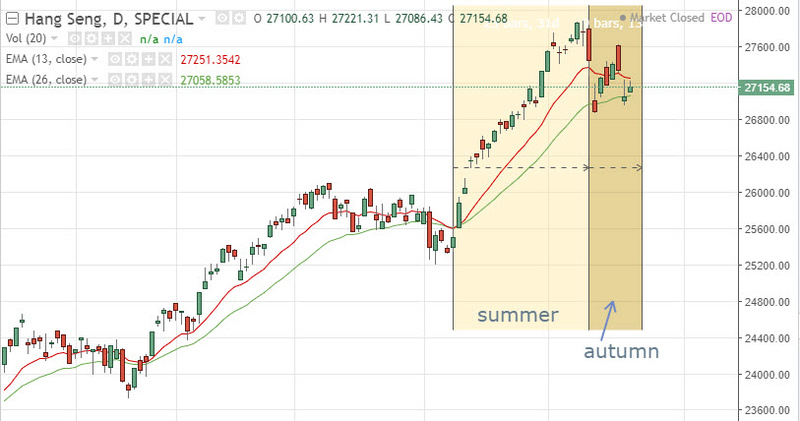
HSI: It's still bright and sunny, but to the observant ones, some of the leaves on the trees are turning brown and starting to fall


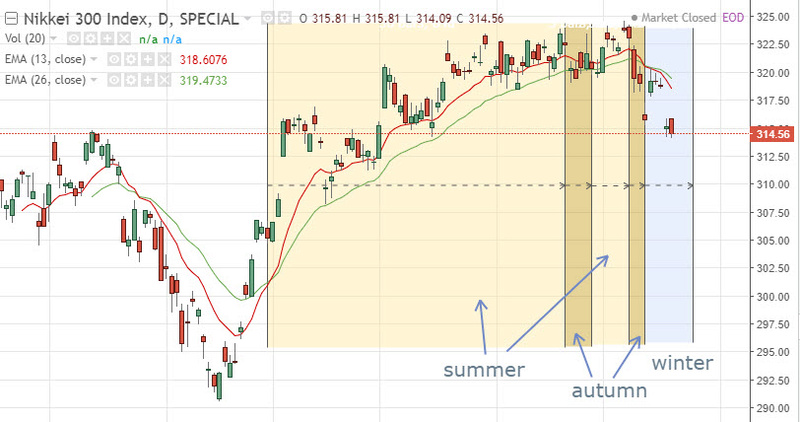
Nikkei: strange weather phenomenon. Very long summer, a fake autumn, another shorter summer and a brief autumn, bringing us to winter now


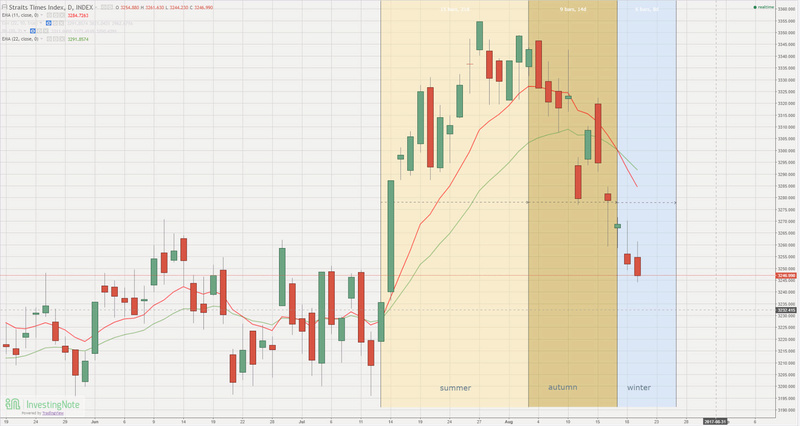
STI: winter is coming (or had already come).


This is neither a rally to buy or to sell, it's simply weather reporting. I'm not even forecasting. Doesn't matter whether it's summer or winter, we just make sure we fatten ourselves during summer to prepare for winter, and do the necessary prep work to plant the seeds just when the last snow falls to prepare for the bright sunlight during summer.

Wednesday, June 14, 2017

The 4 Seasons

There is a time and season to do certain things, and most things go about in their own cycles. It's the same for investing or trading. There's a time to sow the seeds, a time to wait, a time to harvest and a time to just lie in bed and do nothing. Today, we're going to talk about the seasons in my trading.

There are 4 seasons: Spring, Summer, Autumn and Winter. Each defines a certain mood that characterizes both the change in climate as well as the activities that follows it.

Spring: A new hope, a new beginning. This signals a change from the cold harsh winter months. The first shoots breaks out from the soil to welcome the warmer climate.

Summer: Hot hot hot. Every one is coming out to play while the sun shines the brightest and longest. Full bloom of the flowers.

Autumn: Weather starts to turn a little cooler. The colourful bloom of flowers is all but over while the leaves shed to prepare for the winter months ahead.

Winter: Cold, dry and lifeless. Animals hibernate, humans hide in warmth together.


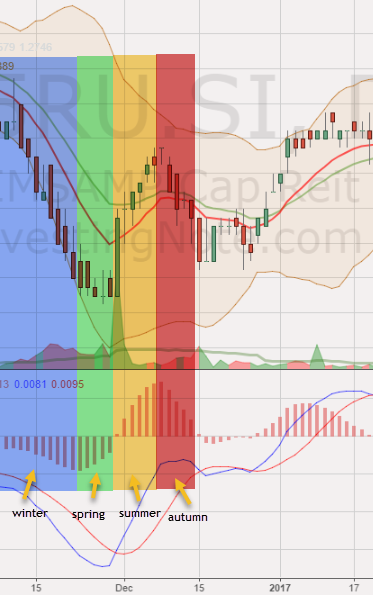
We can tell which season by looking at an oscillator like the MACD histogram. Just look at the slope and the direction of the histogram (is it above the x-axis or below?).

Spring: MACD slope is positive, histogram below x-axis
Summer: MACD slope is positive, histogram above x-axis
Autumn: MACD slope is negative, histogram above x-axis
Winter: MACD slope is negative, histogram below x-axis


So, do you buy during winter, spring, summer or autumn? It depends on your school of thought. I'm a counter-trend person, so I'm much more active during the coldest part of winter towards spring. I think most trend followers will be much more active during summer. No wrong or right, just preference and temperament. I'm long only, so I try to buy during winter and sell during summer, but I can imagine a short only person doing completely opposite of what I do i.e. sell during summer and buy back during winter.

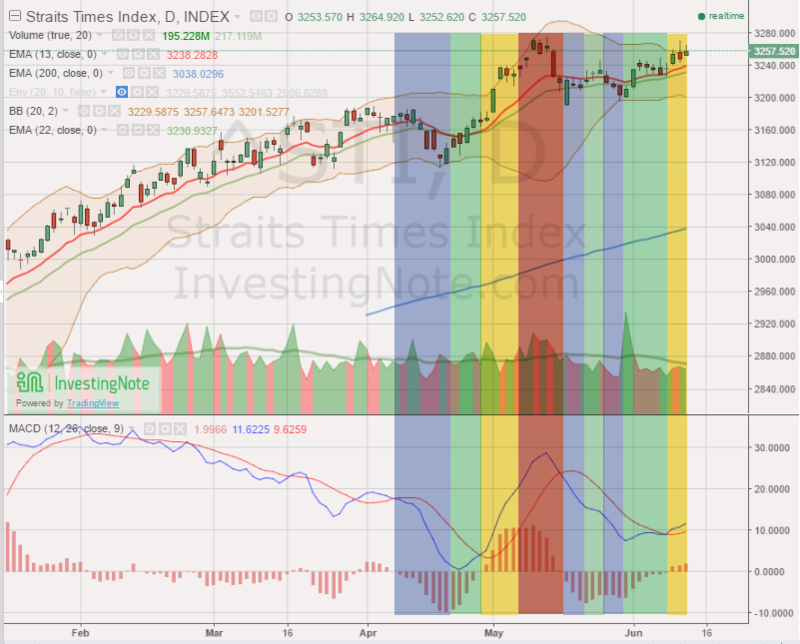
Let's take a look at STI with regards to the 4 seasons. Below is the daily chart of STI.


First of all, it can be a complicated year with more than 4 seasons. Blame it on climate change lol! We see winter-spring-summer-autumn then followed by a complex winter-spring-winter-spring and finally summer season.

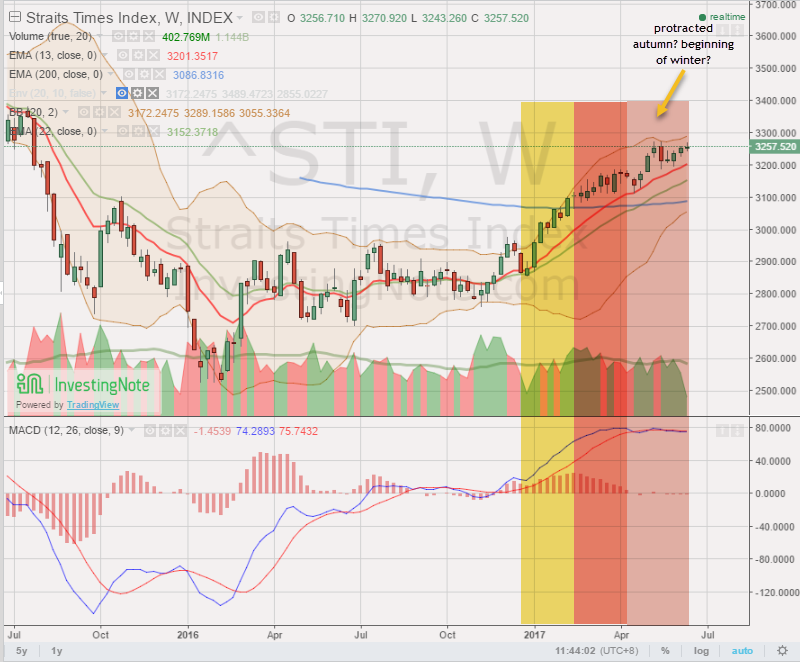
But let's zoom out and see the weekly chart. The weekly chart allows us to view the bigger picture, which is about 5 times more than the daily chart. Why 5 times? There are typically 5 trading days in a week, so each bar on the weekly chart represents 5 trading days worth of information. Hence, looking at the weekly chart allow us to see the macro view in a way that the daily chart can't allow us to see. It's like looking at the hour to hour weather vs day to day weather and month to month weather. As the time frame gets longer, you see the bigger picture at work.


What do you see? I see a summer and an autumn that is long gone since April. Not sure which season we're in right now, because it looks like a protracted autumn or an incoming winter. Or maybe the weather will change and we're back in summer? Who knows such things? (Those who are interested might look at the monthly STI to see another perspective of the situation we're in.)

I know since it's not the deepest winter yet, hence my watchlist is almost empty, I should make hay while the sun still shines. When the cold wind nearly dies down, and just before the robins and the first shoots are out, and while the bear is hibernating, I'll be there. In the meantime, Bully the bear will prepare for winter by eating more to put on enough body fats to make it through the winter LOL

Thursday, May 25, 2017

Is Haw Par a golden tiger or a sick cat?

This is a guest post by the kind folks over at Investingnote. It seems that now they have an in house technical chartist and an analyst as well. Good for them. It's quite a detailed analysis with FA and TA perspective, but this kind of company isn't my cup of tea, LOL. The chart failed to trigger any buys in my system, so yeah, it's good to know about the company and keep it in mind the next time you use their signature muscle rubs or ointment.

-----------------------------------------------------

A Golden Tiger: $Haw Par(H02 )


This column is jointly written by @fayewang, @calvinwee, @gordon_ong and @devinnath

 -Faye is both a fundamental analyst and economist by nature. She is a global thinker who’s open-minded and enjoys learning from the market.
 -Calvin is a fundamental analyst at heart and an ardent disciple of value investing. He relishes the process of searching for undervalued stocks and enjoys collecting dividends from his stocks.
 -Gordon has a demonstrable interest in equity investments, financial markets, and negotiating deals. As @NTUInvestmentClub president, he has an understanding of what factors drive an organisation’s success. -Devin is a technical analyst who balances FA and TA in his investment decisions. He believes in using news and FA to spot the right stocks and rely on TA to give him the lowest risk-to-reward ratio possible.

Brief Background: Haw Par Corporation Limited is engaged in manufacturing, marketing and trading healthcare products; providing leisure-related goods and services, and investing in properties and securities. The principal activities of the Company are licensing of the Tiger trademarks and owning investments for long-term holding purposes, the history of the brothers Haw and Par traced back to the 19th century. The company distributes its products in the Americas, Africa, the Middle East, Asia, Australasia, and Europe.

Product Segments: Haw Par operates in four segments, namely
1) Healthcare - principally manufactures and distributes topical analgesic products such as Tiger Balm and Kwan Loong.
2) Leisure - provides family and tourist oriented leisure alternatives through its owned and operated oceanarium, including Underwater World Pattaya in Thailand.
3) Property - owns and leases out various investment properties in the Asia region.
4) Investment - invests primarily in quoted and unquoted securities in Asia region.

Performance Summary: Haw Par recorded a dip in profit from operations and investments of 2% mainly attributable to lower dividend income from investments. However, it should be noted that all operating segments generated higher profits in FY16. The healthcare business segment continued to contribute significantly to the Group’s revenue with a 16% increase in revenue from $152.6 million to $176.4 million. Correspondingly, healthcare’s profit increased 37% from $48.1 million to $66.1 million with higher sales and reduced operating expenditure. However, revenue from the leisure business segment registered a sharp drop of 34% to $8.4 million due to the closure of Underwater World Singapore (“UWS”) in June 2016. Therefore, leisure recorded profit of $0.9 million in FY16 compared to loss of $4.3 million in FY15 due to the one-off impairment charge in fixed assets of UWS in 2015.

Financial Highlights:


 1. Operating performance Haw Par Corporation’s revenue has increased steadily since 2012, and this is also reflected in its profit before taxes. However, PBT decreased slightly by 1.6% yoy due to the lower dividend income received from investments. In that light, it should be noted that all of its operating segments generated higher profits yoy, however the profit contribution from Investments dropped by 31%, leading to an overall decline in PBT.

2. Financial & cash position Haw Par’s Operation Cash flow recorded yoy increase since 2012, and FY16 was no different since it reported higher profits across all its operating segments. However, there was a sharp drop in its total cash flow by 30% yoy. This is attributed by the decrease in financing cashflows by $24.8Million. Correspondingly, it recorded a fall in the lower cash and cash equivalent in the balance sheet by 0.51% yoy.

3. Segment performance Traditionally, Haw Par Corporation derives its revenue from the investments income segment. The overall group revenue for FY16 at $201.6 million grew 13% yoy, with Healthcare and Property recording 16% and 25% increase in revenue respectively. Operating segment profits before interest expense and tax for Healthcare and Property grew 37% and 22% respectively. However, investments income decreased 31% due to lower dividend income from investments.

4. Stock information Haw Par Corporation has a very low D/E ratio of 2%, hence it can raise additional financing if they wish to acquire more assets in any of their business segments. On the other hand, Haw Par does not have a remarkable ROE and ROA, hovering between 4-7% from 2012-2016. This is likely because most of its business segments are in the mature stage and have limited growth potential. However, it should be once again noted that it derives most of its revenue/profits from its interest in UOB, UIC and UOL group, hence its overall profits is highly dependent on the performance of these 3 companies. Haw Par has a dividend yield 1.9% for FY16. We were unable to find a comparable company for Haw Par Corporation in the SGX stock universe, hence, we decided to skip the peer analysis for Haw Par Corporation.

SWOT Analysis


Strengths:

1. Renown of brand. Brand of Haw Par retains a history over 100 years that can be traced back to 1920s. With famous Tiger Balm as its representative product, Haw Par held competitive advantages of competition in the healthcare industry considering exceptional brand awareness. Despite the long history, Tiger Balm became iconic for the sake of its incorporation in Singapore traditional culture. Brand loyalty is another benefit from well brand management. It is brand loyalty that become a significant obstacle for new entrants, as they may fail in the competition due to strong brand loyalty of customers to existing players.

 2. Uniqueness of products. Haw par differentiates its Tiger Balm from other healthcare products with secret herbal formulation. Therefore, the effect of substitution seems limited to Tiger Balm. For sure there are other pharmaceutical manufacturers who provide analgesic products, for instance, liniments or oils made by using Chinese medicine. Nevertheless, they can merely bring competition but cannot replace Tiger Balm. In Singapore market, the uniqueness of Haw par is more apparent, it is difficult to find a listed company that operate similar business as Haw par does.

 3. Organic Growth of Core Business. Though Haw par is involved in various industry such as property, leisure, and investment, its core competency is derived from healthcare segment. Growing proportion of profit from investment segment has been observed in recent years, which makes Haw par looks like an investment holding firm. However, it is worth noting that revenue generated from its healthcare products enjoy continuous growth with an average rate of 40% over 5 years.

Weaknesses:

1. Haw Par’s leisure segment. Main business of Haw par’s leisure segment is its Underwater World Pattaya (UWP) in Thailand and Underwater World Singapore (UWS) in Singapore. Profit contributed from Leisure segment has experienced continuous decline since 2012. The segment suffered from loss in financial year of 2015, which is related to the terrorist attack at Bangkok in August 2015 and flash flood in Pattaya. Leisure’s profit swung to black in 2016, while Haw par decided to close UWS afterwards. The close was claimed due to the expiry of lease contract on Sentosa island, albeit more likely to be for profit improvement purpose.

2. Investment portfolio. In Haw par’s balance sheet, financial assets occupied 81.9% of its total net assets. In other words, majority of its net assets is made of securities of UOB, UOL, and UIC, which worth $2 billion in 2016. Therefore, Haw par’s profitability is closely tied to the performance of UOB, UOL and UIC. The investment portfolio cannot be considered as absolute ‘weakness ‘of Haw Par, but it exposes Haw par with greater volatility to the performance.


Opportunities:

1. Further expansion. To fully utilize the renown of Haw par’s brand, Haw par can make more efforts to expand their business for greater presence in the global market. At the current stage, income generated from local market merely occupies 18.6% of the total number, meanwhile 35% of the revenue contributed by other Asian countries outside the ASEAN area. Based on the data, we can conclude that Haw par has exploited and penetrated the Asia market, but seems has not started its exploration in other potential countries. With sufficient cash in hand and light debt burden, Haw par is at an appropriate position for global expansion. The expanding strategy can be introducing new products in various markets through franchise.

2. Segment restructuring. Haw par has closed the Underwater World Singapore (UWS) in Sentosa island, thus the segment of leisure greatly shrunk in 2016. As mentioned in the weakness part, the leisure segment suffered from plummeted revenue and the loss even eroded profit from other business. It might be wiser if Haw par gradually shift their investing emphasis to healthcare and investment business only.

3. Long-term flourish healthcare industry. The growing number of aging population and better awareness of healthcare jointly lead to stronger demand for healthcare services in the future. Advanced technology allows Haw par to extend its products line and seek for more opportunities in this resilient industry. Threats: 1. Increasing competitors. Rapid growth in healthcare industry has attracted more companies to enter and share the market pie. Increasing number of competitors is the biggest threat Haw Par is facing now. Products such as Yunnan Baiyao from China and Mopidick’s from Japan have brought intense competition to Tiger Balm.

Key Drivers & Limitations 
Expanding to new markets and modernizing the Tiger Balm brand


Haw Par’s strategy of widening Tiger Balm’s product offerings to include Medicated Plasters, Mosquito Repellents, Cooling Patches and Lotions, as well as modernising the packaging and marketing strategies, seems to have revitalised its attractiveness to consumers. Haw Par has also successfully capitalised on the recent ASEAN mosquito virus outbreaks to increase sales. With such outbreaks being frequent within the region, Haw Par has a consistent sales driver.

Haw Par has also capitalised on Tiger Balm’s brand strength to attract distributors and remain asset-light – recently, it has partnered with Alkem to expand its distribution network in India. Haw Par’s distribution network remains formidable throughout the world. Such a business model means that Haw Par can sustain its high margins in the foreseeable future.

Acquisition for growth in Healthcare/Leisure segments 
Haw Par is currently seeking acquisition targets to utilise its net cash position. It has stated that it may do horizontal integration of other healthcare products to add to its Tiger Balm brand. Such an acquisition will support the overall business-level strategy of dominating the topical analgesic market through consolidation under a single brand. Haw Par also seeks to acquire leisure destinations to utilise its decades-old expertise of running tourist attractions. Depending on the acquisition target, this will most likely increase Haw Par’s low ROE and unlock shareholder value. Haw Par seeks to maintain its low profit margins; hence it will most likely acquire products rather than expand overseas using physical stores.

Exposure to Banking and Real Estate Sectors
Haw Par not only has equity investments within banking and real estate, but also has its own property division. Hence, its asset value and investment income stream are exposed to the high earnings expectations on SG banks, as well as occupancy rates/rental yields from its SG and MY properties.

Analysts’ Opinion 
Key takeaways by @calvinwee

Haw Par is a household brand synonymous with its flagship product: Tiger Balm. However, with deeper analysis, one will realize that over the years, Haw Par Corporation has diversified into different business segments such as leisure and property. Also, management has shown great prudence in maintaining a strong balance sheet and free cash flows. Most importantly, it derives a substantial portion of its profits from UOB, a big 3 bank in Singapore. I am of the view that its healthcare segment has the potential to grow, albeit at a slower rate, with its expansion into European and US markets. Barring no major changes in the 3 companies that it is vested in, Haw Par Corporation is a safe haven amidst the volatility in the market.

Comments below is written by @Gordon_ong:

Haw Par is a Portfolio of UOB, UOL and UIC at deeply discounted values 
To find out what is Haw Par’s current equity stake in UOB, UOL and UIC, we first assume that there are no changes in shareholdings since FY16 annual report. To test this assumption, we will see what is the fair value change on these financial assets (FVOCI) for 1Q. If there are no changes in shareholdings since the last annual report, the fair value change should be 182m.


 The actual fair value change as stated in 1Q report is 189m, almost the same as assumed. Hence, we can conclude that there are no significant changes in Haw Par’s investment holdings.


Hence, based on the share price of $10.43 and market cap of $2.290B, the Total Enterprise Value is $2.015B. This TEV includes a liquid portfolio of 3 shares with combined market value of $2.2B, Investment Properties of $200M valuation, and a business worth about $1B. Based on a sum-of-parts valuation, TEV should equal to $3.4B and market price should be ≈$15. It can be argued that the market has grossly undervalued the price of Haw Par. In fact, purchasing Haw Par shares means acquiring an investment portfolio for cheap, as well as a stake in the investment properties and the underlying Haw Par business for free. 

Usually, stocks that trade at a discount to NAV have negative operating profits. However, in Haw Par’s case, not only is the Tiger Balm healthcare business still profitable and growing, the net assets are not hard-to-dispose-of fixed assets, but equity stakes in other businesses. 

One consideration is whether Haw Par is a “value trap”, a.k.a Haw Par will hoard the dividends paid by its investments within its business without distributing to its shareholders. Even in this worst-case scenario, as Haw Par’s main businesses are profitable, defensive and secured by a deep economic moat (brand strength), Haw Par’s cash position and equity stakes will just grow indefinitely until a catalyst unlocks value for shareholders e.g. continued growth of healthcare product segment or some form of M&A. To test whether Haw Par hoards cash, we simply measure the investment income received vs. dividends paid out.


 While Haw Par does retain a portion of its investment income, its other business segments contribute such that the total dividends paid is higher than an equivalent weighted portfolio consisting of UOB, UOL and UIC. Notably, healthcare segment’s growth in new markets support Haw Par’s ability to pay out higher dividends recently. 

The Dividend Payout Ratio and Historical Dividend Yield also show that dividends from Haw Par is near equivalent to investing in a weighted portfolio of the 3 stocks. Even though the dividend yield of Haw Par is slightly lower, the excess cash is going into Haw Par’s cash reserves. Hence, the 48 b.p. is not lost, but merely locked up within Haw Par’s cash reserves, which shareholders still own a stake of. 

Overall, Haw Par does indeed distribute its investment income from its equity portfolio to its shareholders. A shareholder of Haw Par will gain more dividend benefits compared to directly holding an equivalent portfolio of the three shares. As the risk of Haw Par suddenly hoarding investment income is negligible given its track record, there should not exist such a discount on valuation for Haw Par’s equity portfolio. 

Unless you believe that UOB, UOL and UIC are grossly overvalued by the market, as long as Haw Par’s TEV remains lower than the market value of its equity portfolio, it makes complete sense to buy more of Haw Par. While acknowledging that Haw Par has been consistently undervalued for the past 10 years vis-à-vis its equity holdings, the gap between Haw Par’s value and its equity holdings has narrowed, signaling that the market has taken notice. 

Investors should view Haw Par primarily as an Investment Holding company at discount prices, with its success as a healthcare product company as a pure bonus.

For investors interested in $UOB(U11), can consider purchasing shares through $Haw Par(H02) for greater value. A portfolio of banks, real estate and healthcare seem to fair well against interest rate risk. Vested in Haw Par; DYODD. Downsides: During expansion, management may decide to modify Haw Par’s healthcare segment from an asset-light distribution model to an asset-heavy model, requiring cash. However, unlikely based on conservative management’s previous reinvestment rate. Also, SG Banking and Real Estate sectors may weaken affecting value of equity holdings – yet holding an isolated UOB/UOL/UIC stock will be even worse in that scenario. 

Technical Analysis 
 From TA (Technical Analysis) perspective, followings are the analysis of Haw Par as of 23rd May 2017. This part is written by @devinnath.


-Taking highest high and lowest low from 12 month time frame (July 2016), it appears that Haw Par stock price has been testing the resistance line at $10.500 since the beginning of May 2017. 
-Channel width is considerably wide, contributed by the bullish steam at the start of 2017 (Jan-Feb). Although an untested weak support range is formed between $9.745 and $9.837, strong support remains low at $9.360 
-Stochastic Oscillator (14,3,3) and MACD (12,26,close,9) both agree that there is no apparent highlight of trend being formed in the past month, although both indicators signalling a slight uptrend (MACD : 0.1117) and minimal buying pressure in the market (slow %K = %D : 65). 
-Parabolic SAR on the other hand acknowledges the position of the price on upper boundary of Bollinger Band (20,2) by showing a possible price stop and reversal, hence the stock price might be taking a bearish stance in the near future. 

I believe that it is rather reasonable for investors to expect a significant attempt to break the strong resistance line at 10.500. This attempt will be indicated by a sharp hike in price above $10.500, which the result will determine the future trend direction of Haw Par stock. 

Best case scenario: If price manages to break the resistance line and stays there for at least 2 days, then high chance it will continue to take its bullish stance. Once its position is reinforced, it will be the perfect time to enter the trade. 

Worst case scenario: If price fails to stay above the resistance for 2 days, similar event with 12th May might reoccur, e.g. price broke through the resistance but failed to maintain its stance as bearish engulfing pattern appears the following day. It will form a double top pattern which might impose a very strong selling pressure. This might be followed by breaking the weak support towards the strong support line. 

Conclusion: In order to mitigate risk, It will be in our best interest to wait and see how the market behaves around the resistance and let time reveals itself. 

This article is written by by @fayewang, @calvinwee, @gordon_ong and @devinnath from InvestingNote. 


InvestingNote is the free social network platform designed specifically for crowdsourced investment ideas, news and interaction for the holistic stock investing community. Investors can identify trends, market movements and sentiments through crowdsource analysis that can make them better at investing. With free access to a wide variety of stock data, investors can upload research reports, utilize technical charts and make stock price targets that will be visible to other investors. It promotes financial literacy and connects investors for better investing outcomes. Our users come from a wide spectrum of the investing community: remisiers, brokers, brokerage houses, financial writers, financial bloggers and the general retail investors.

Thursday, March 02, 2017

Comfort delgo : Goodbye or good buy?

This is a guest post from Investingnote. It's regarding Comfort delgro and it's mainly about touch and go FA and other industry news. I had already bought it some days ago and my views can be summarised in two pictures:

Comfortdelgro weekly: bullish weekly divergence

Comfortdelgo daily: break out of down trend line and retracing back to trendline
---------------------------------------------------------------------------------

Can ComfortDelGro(C52) regain its customers of taxi service?


Brief Background of ComfortDelGro: 

ComfortDelGro Corporation Limited is a Singapore-based investment holding and management services company. It operates in eight segments:

1) Bus & bus station
2) Rail
3) Taxi
4) car rental and leasing
5) automotive engineering services
6) inspection and testing service
7) driving centre and
8) insurance broking services and outdoor advertising.

Summary of ComfortDelGro’s recent financial performance: 

The group maintains a steady growth of net profit despite a slight revenue decline caused by unfavourable currency translation this year. With the entrance and fierce competition brought by Uber and Grab, ComfortDelGro’s taxi business succeed to keep growing profitability. The five-year lowest P/E ratio indicates it is undervalued in a greater degree by the market. However, ComfortDelGro’s actions and measures towards issue of diesel tax and further competition are vital.

Recent Event: 10 Feb 2017 ComfortDelGro - Full Yearly Results of 2016 

Key Financial & Operating Highlights:

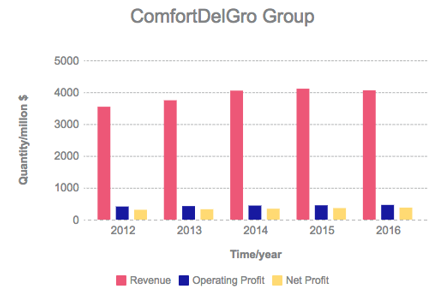
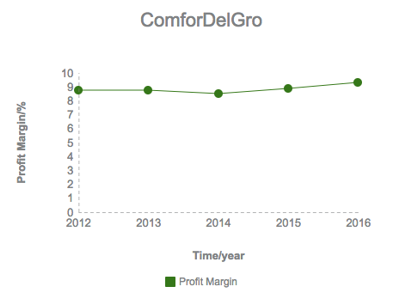
1. ComfortDelGro group had a steady growth of revenue during the period from 2012 to 2015, but experienced a light drop (1.26%) of revenue in 2016, which is mainly caused by unfavourable foreign currency translation, as the Group revenue should have been increased 1.76% by $72.4m. Stable growth of both operating and net revenue can be observed, but the growth rate has been declined after 2014. Also, the group achieved its highest profit margin in 2016.


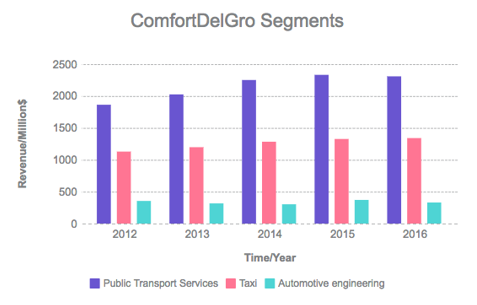
2. From the perspective of segments operation (the eight segments can be found in the previous part of Brief Background), in the financial year of 2016, more than half (57%) of the group revenue was contributed from the segment of Public Transport Services Business. One third (33%) of the group revenue was driven by the segment of Taxi business, which is also the most discussed segment in recent years because of the competition from Uber and Grab. Approximate 10% of their revenue came from the Automotive engineering services.


The chart represents revenue of the three largest segments of ComfortDelGro. According to the chart, revenue of taxi business managed to maintain slow growth under the competitive pressure of Uber and Grab, especially after the aggressive expansion of Uber in early 2015. ComfortDelGro stated in their financial report that the revenue growth in the Public Transport Services Business, Taxi business, and the Driving centre business was offset by the decrease at Automotive engineering services business, the Inspection and Testing Services Business, the Car Rental and Leasing Business and the Bus Station Business.


3. Compared to the number of 31 Dec 2015, the group burdened less secured and unsecured borrowings and less payables. Total equity had a growth of 5.96%. Net cash generated from operating activities edged up to $702.5m from $600.2m at the same period of last year. However, the amount of free cash flow has a small slide of 1%. Overall, the group maintained a stable financial and cash flow position.


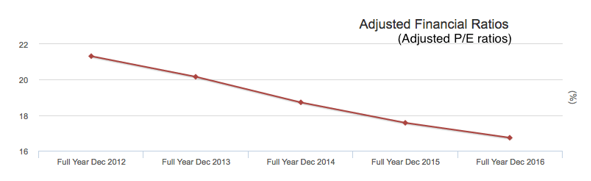
4. Now the group has a P/E ratio of 16.732, lower than that of the Transport industry (33.267), it is also the lowest number observed during the five-year period since 2012. The Earning per share (EPS) is 14.7 cents, with a dividend yield of 4.187%. (source: here)


ComfortDelGro’s Competition with Uber and Grab:

Are entrants of private-hire car threatening the profitability of taxi business?
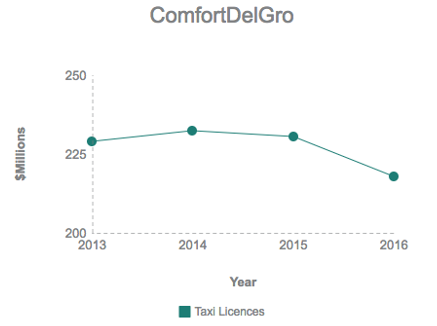
After Uber and Grab entered the market, the amount of taxi licences issued was indeed affected by the rivalry.

“There are early signs of taxi weakness”, refer to the full article here.

For ComfortDelGro, the quantity of taxi licences were prone to fall since 2014.


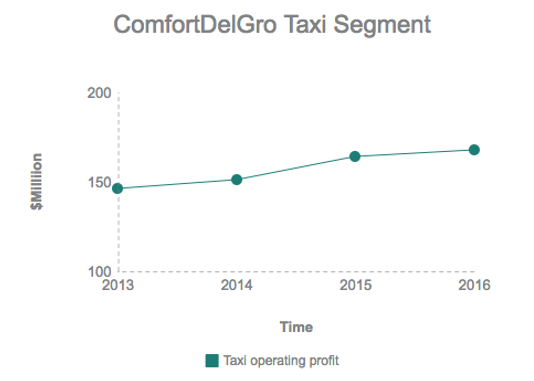
However, the group presented positive numbers in both revenue and operating profit of Taxi segment during the recent years.
Hence, during the competition with Uber and Grab in the taxi industry, ComfortDelGro neither suffer from decreasing profit nor from loss. The possible reason could be that certain amount of consumers choose Uber/Grab because of the attractive coupons/Promo code they can use for car services. However, under the circumstance of urgency, they still prefer taxis as they do not have the time to schedule rides in advance and do not wish to waste time waiting for the Uber drivers. ComfortDelGro has witnessed improvement in service quality since they started the competition with Uber and Grab.

Is the Business of Uber and Grab sustainable?


Uber and Grab have proved their success by conquering the Singapore market and becoming well aware by people within a short period of time, but still, they face various obstacles with their operations.

1. How long can they allure customers by using promo code?

2. Private hire cars obey the Road Traffic Act (RTA) that they cannot carry a passenger who is under 1.35m without a booster seat or a child restraint. Taxi do not required to follow this Act because they are public vehicles. Related news here.

3. Singapore's private car hire business including Uber and Gran need to be licensed according to the amendments to the Road Traffic Act (RTA) after 7 February. Related news here.

4. Private-hire scam deteriorate customer’s trust. Related news here.


New threat: increasing diesel cost and new competitor HDT singapore

The Budget 2017 of Singapore announced the levy of diesel tax of 10 cents per litre, thus increase the operating cost of taxi business. Though taxi operators adopt plans to pass on tax reduction savings to drivers by less rental fee, the actual cost will increase according to research.

“Budget 2017: SMRT, ComfortDelGro to pass on diesel tax savings to taxi drivers”, to see the full article here.

“Diesel tax will add to costs, say cabbies”, refer to the full article here.

The new competitor HDT taxi company expand their customer base quickly and adopt a fixed salaries with benefit plan. Refer to the full article here.


Trans-Cab and Premier Taxi adopt new plans to attract cabbies

The 2 taxi operators introduce surge pricing (dynamic fares) and cut their rental fee to deal with competitions from Uber/Grab. But ComfortDelGro, as well as SMRT taxi, has not disclosed any intention towards the new plan.

Related news: “2 taxi firms plan to Grab hold of more customers”, shared in the post of @FGD, refer to the news here.

“Trans-Cab cuts rental fees in bid to attract cabbies” here.


What's the discussion in our community? 

“Ever-increasing challenges for Uber’s profitability”, shared by @alansmith in the post of https://www.investingnote.com/posts/47910

“Cab operators urged to offer driver more job options”, shared by @bgting in the post of :https://www.investingnote.com/posts/47721

@yjlim queried the opinion that Uber/Grab threat the business of ComfortDelGro in Taxi business, to see further discussion and share you opinion in the post :https://www.investingnote.com/posts/46795

@raynersu held the opinion that ComfortDelGro group did not make enough effort in updating their strategy for the latest market trend but rather stay out-of-fashion, while their peer Taxi operators keep improving and acquiring larger share of market gradually. Refer to more discussion in the post:
https://www.investingnote.com/posts/48547


Our Key Takeaway: 

ComfortDelGro performed well under the fierce competition with private hire services and new entrants in Taxi business. Under the circumstance that Uber or Grab maintain their operating strategy, ComfortDelGro group has a great chance to gradually gain their customers in Taxi services back. However, facing with declining growth of revenue, ComfortDelGro group has to carry out appropriate measures to deal with rising diesel cost and make greater efforts on cost reduction. Additionally, ComfortDelGro’s movement towards the latest plan promoted by Trans-Cab and Premier Taxi is vital.

For ComfortDelGro, and also for the taxi industry, it is the right time to have an innovation now.

Also check out some estimations:
@Breaddbutter: https://www.investingnote.com/posts/44331
@simontan0: https://www.investingnote.com/posts/47904 
@Lunner: https://www.investingnote.com/posts/47895
@hk1: https://www.investingnote.com/posts/47859 
@thatsasecret: https://www.investingnote.com/posts/47204
@chinnamng: https://www.investingnote.com/posts/46630

Friday, August 26, 2016

Using Investingnote's charting platform

I wanted to help those who are newer to Investingnote, my preferred charting software, hence I'm writing this post. I think the people over at Investingnote are really doing a fine job with a free charting software. It's actually quite powerful and I especially like the real time (okay, it lags by at most 2 minutes) update of the charts. Yahoo finance maybe lags by 10 to 15 mins? I've not seen a charting software that updates realtime too, perhaps except those by brokerage platform. But those are pretty laggy and buggy so I don't like to use them much.

This is not a sponsored post. I just think it's a great tool for people to use it, so I'm sharing it. This is also not a tutorial to show you how to use the charting software, but more of how I use the charting software at Investingnote.

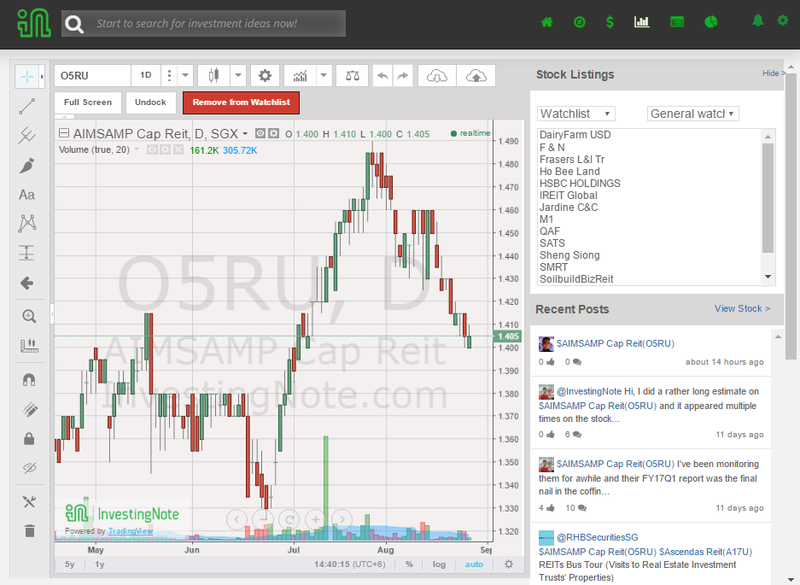
When you logged in and click on the "Charts" option on the upper right corner of the platform, you're going to see something like this screen:


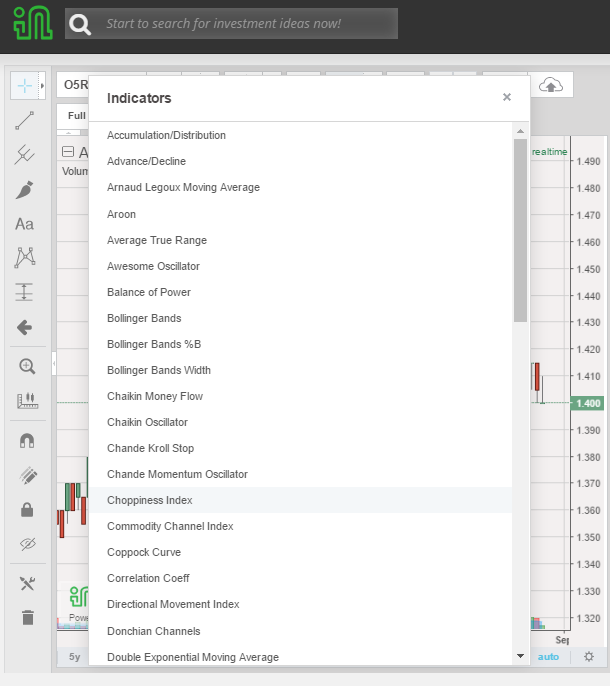
I like to add a few indicators to my chart. I mouse over the symbol with the charts, and you'll see "Indicators" appearing.


Clicking on it will bring you to the list of indicators available for you to add in. I proceeded to add in MACD, Elders Force index and Moving exponential by clicking on the names. It'll automatically be added to the charts.


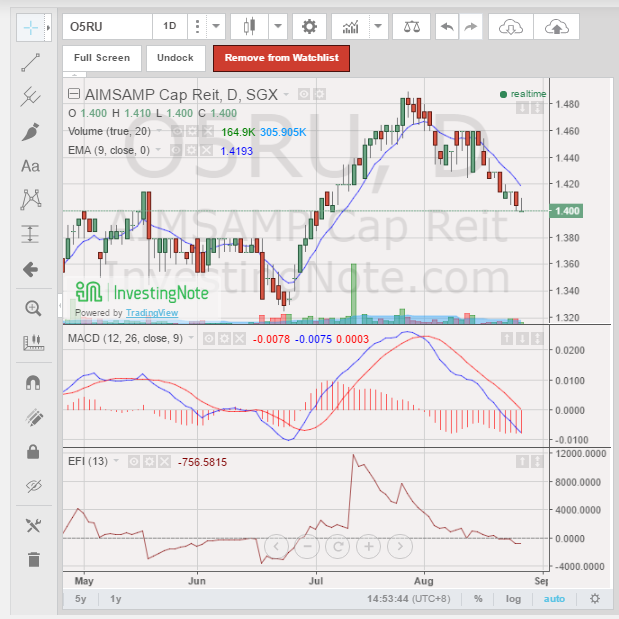
Now my charts look like this:


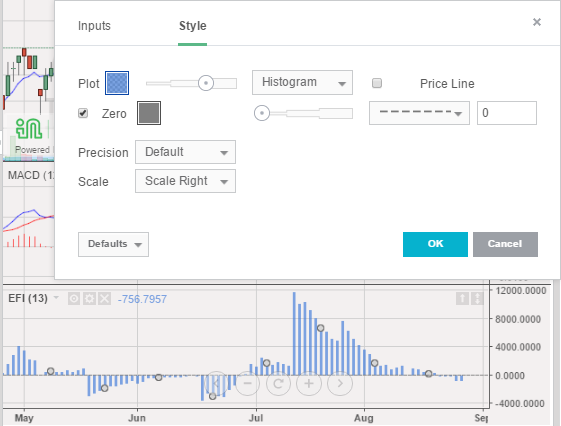
I don't like the Elders Force index (EFI) in a line form. I prefer the histogram format, so I'm going to change it. I mouse my cursor over to the gear symbol just to the right of the word EFI. It's the middle icon. You're going to see the word "Format" appearing. Click on that. You'll see "Inputs" and "Style" menu above.


Play around with the options. I changed the colour of the plot to blue, line to histogram, and thickened the width of the histogram, as shown below:


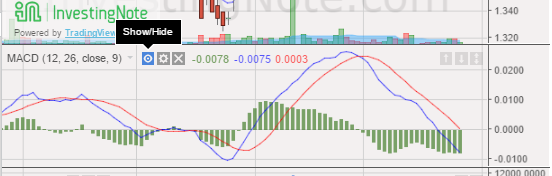
If you're satisfied, you can click OK and it'll be shown on the chart. I did the same format adjustment to MACD too. Let's say you don't want to see the MACD appearing, you can hide it by clicking on the first icon next to the indicator:


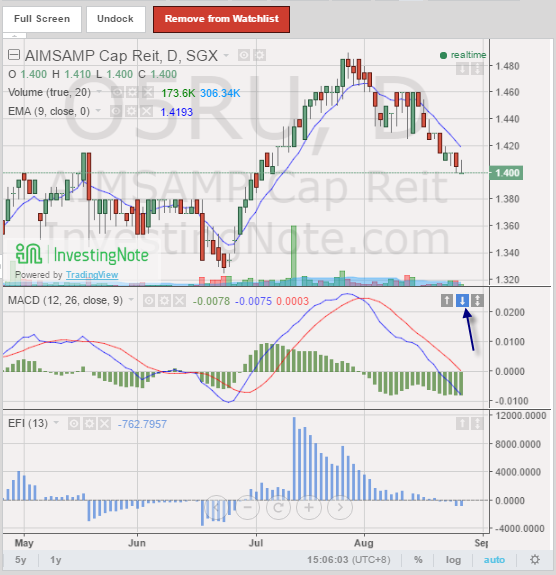
You can also shift the order of the indicator up or down. Let's say I want to move my MACD indicator right at the bottom of the chart. I'll press the down button on the top right corner of the indicator box:


Once you've pressed it, the indicator can move up or down according to your liking. You can also draw trendlines, horizontal support, fibo etc by looking at left side of the chart:


Let's go ahead and choose the fibo retracement lines:


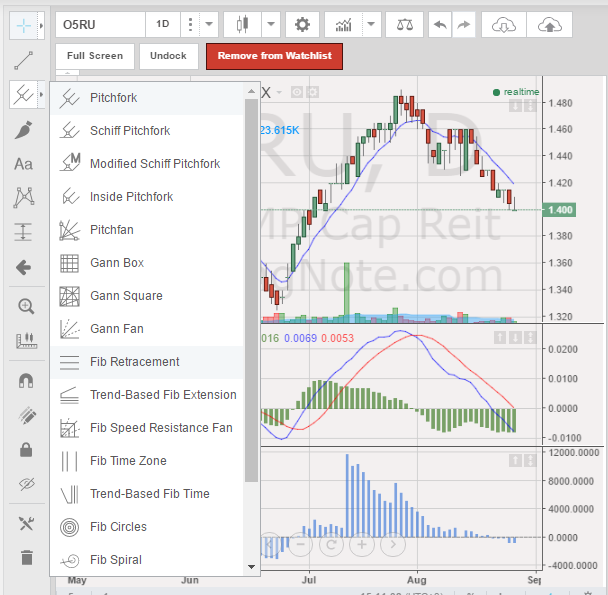
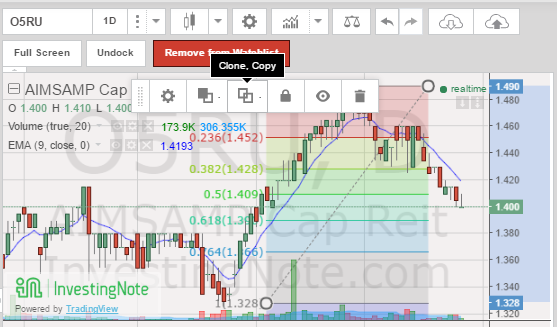
It's the second symbol, click on that small arrow and you'll see a whole host of options available. Let's go ahead and choose Fib retracement and draw it out. You'll see the results below:


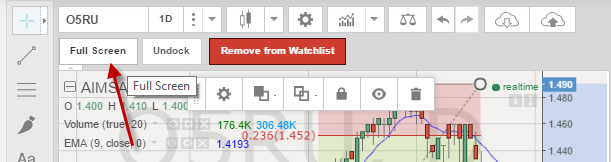
If it's too small and too much things happening on your chart, you can click full screen and blow up the chart to see it clearer:


Okay, here's the important trick. How do you save the nice charts and drawings you've done? There are two ways:

1. Saving individual charts:

Click on the Save chart layout symbol and save everything you're working on for that particular chart. They will ask you to give a chart layout name.


Once you've entered the chart name, you can retrieve it back anytime by pressing the Load chart layout

You can save your work this way.

2. Saving template:

I prefer saving template, so that I can apply this particular set of template (with this set of indicators and format) to different charts. So here's how to do it:

Click on the study template:


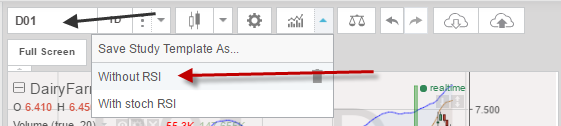
You will see the option to "Save study template as". Click on it, give the template a name and you will be able to put this set of layout onto any charts you want easily.


I saved two template (as shown above by the red arrow), the first is "without RSI" and the second is "with stoch RSI".  If I clicked on the template "Without RSI" and click on the box (marked by the black arrow) and type the name of the counter (e.g. SHENG SIONG), I will apply this template onto the chart of Sheng siong.


Of course there are many more functions that I didn't illustrate but I think this is a good starting point to explore the platform yourself.

Thursday, June 16, 2016

Bullish / Bearish divergence

I thought I'll never write another article on technical analysis again. But here I go again. I trade on divergence, so it's a counter trend trading, if you want to classify which school of TA I'm into. Divergence means that there is a pair of things moving in opposite direction. One of the pair is invariably the price of the counter. The other pair could be any indicator, but the one I'm using is MACD histogram.

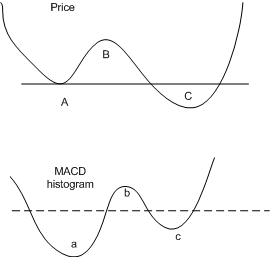
Bullish divergence happens when the price reached a lower low but the indicator reached a higher low. It's easier to explain this with a diagram.


Points A, B, C are the price points of the counter. a, b and  c are the indicator points. As mentioned, it can be any indicator but I'm using MACD histogram.

A and a - The price reaches a first deep low and the MACD histogram follows suit and reaches a first deep low.

B and b - The price went up and the indicator moves up accordingly too. It's important at his point that the MACD histogram point b moves above the 0 level, indicated by the dotted line.

C and c - The price reaches a lower low than A, thus establishing a lower low in price, but the MACD histogram at c did not reach a lower low than a, thus establishing a higher low.

Bullish divergence happens when price reaches a lower low (C lower than A) but MACD histogram reaches a higher low (c is higher than a). Thus a divergence between price and MACD histogram happens and the price is set to move up higher. The psychology behind this is that the indicator tells us how strong the movement is. When the price A moves down then MACD histogram a moves down accordingly, forming a benchmark for us to compare. If price C moves down even more than A, we will expect the MACD histogram to show us that the movement downwards is a stronger one than at a. Since we didn't see that happening, the second selldown in price C is lacking in strength, indicating that the price will move upwards, forming a bullish divergence.

Real examples:

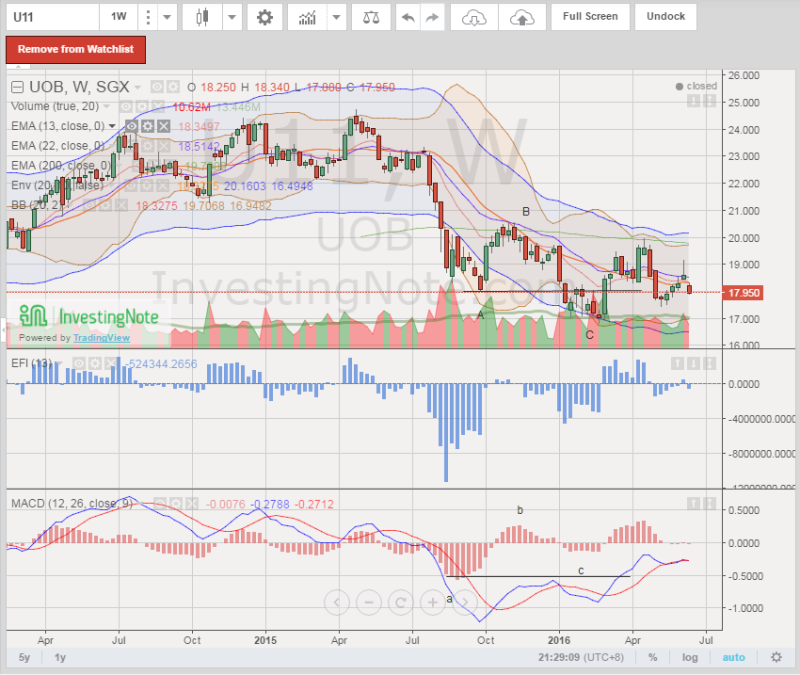
UOB (weekly)


Price A moves down to a first low of about 17.95. Then it moves up to B at about 20 before coming down to a lower low C at about 17. While the price at the second low C is lower than the first low A, the MACD histogram shows us a different picture. Point c is higher than a, so we know that the second selldown at point C is a fake selldown. Price resumes upwards to about $20.

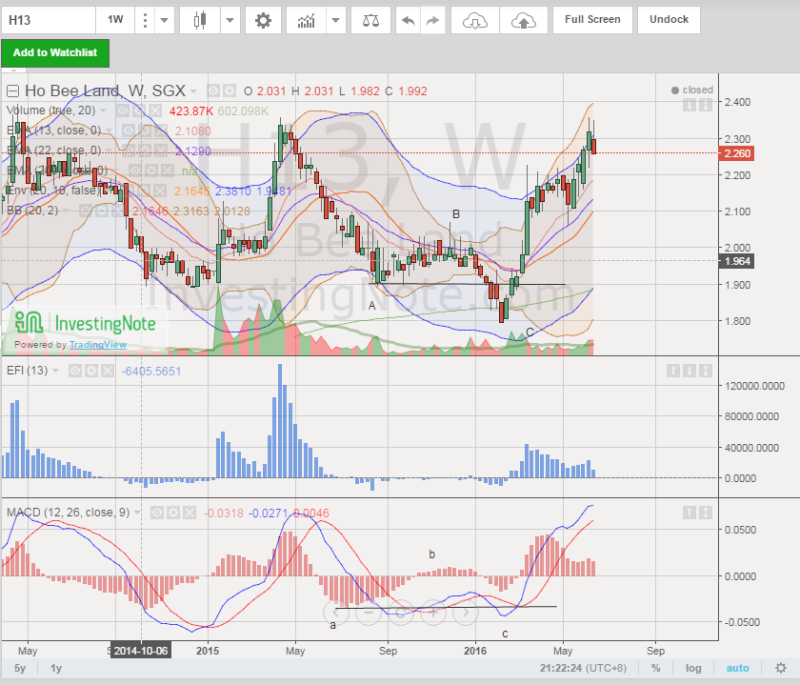
Ho Bee Land (weekly)


Again, you see the that the price C moves lower than A, but the indicator c did not move down lower than a, forming a bullish divergence. The price went up from the low of C at 1.80 to a higher of 2.35+ recently.


Can we go reverse and have a bearish divergence?

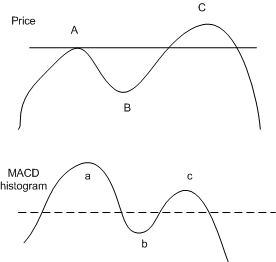
Bearish divergence happens when the price reached a higher high but the indicator reached a lower high. Again, let's see the diagram below to illustrate the scenario:


A and a - The price reaches a first high and the MACD histogram follows suit and reaches a first high.

B and b - The price went down and the indicator moves downwards accordingly. Make sure the the part b is below the 0 line of the MACD histogram mark.

C and c - The price C reaches a higher high compared to A, thus establishing a higher high in price, but the MACD histogram did not reach a higher high than c, thus establishing a higher low.

Thus a bearish divergence forms and the price goes down lower. The reasoning behind this is that the price movement upwards at point C is not accompanied by a stronger push by the indicator c, hence the upwards movement is 'fake' and a downward pressure in price ensues.

Real examples:

UOB (daily)


Price moves up to a first high at A at about 19.5, then moves down towards B at about 18.4 before going upwards again to a new high at C at about 20. While the price at C reaches a higher high than A, the MACD histogram shows us a different story. Point c is at a lower high than a, thus showing us that the 2nd upward movement at C is not real. A bearish divergence happens and the price goes down to about 17.6.

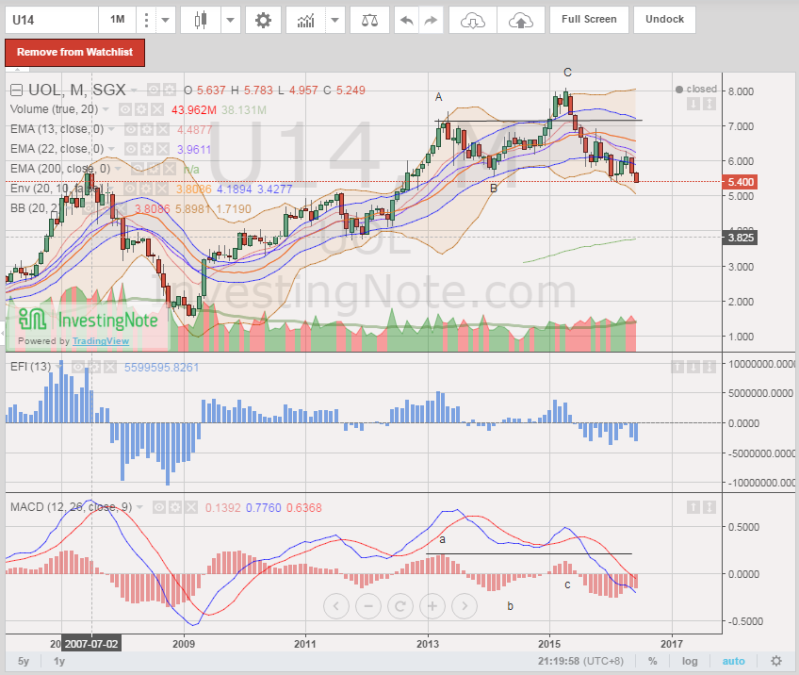
UOL (monthly)


This is a very important example. There are three common time frames that we can use to check for bearish/bullish divergence. They are daily, weekly or monthly. A divergence happening in a monthly timeframe is more powerful than one that occurs in weekly and in daily. A monthly chart shows one bar of candlestick every month, so there are 12 candlesticks in a year. A divergence occurring at monthly timeframe would be a multi year movement, resulting in huge movement.

UOL had a higher price point C near 8 but not accompanied by a higher high c of the MACD histogram. A bearish divergence happens and the price slides from 8 to the current 5.40, dropping nearly 30% from it's high. We could still be in the 'slide' of this bearish divergence right now.


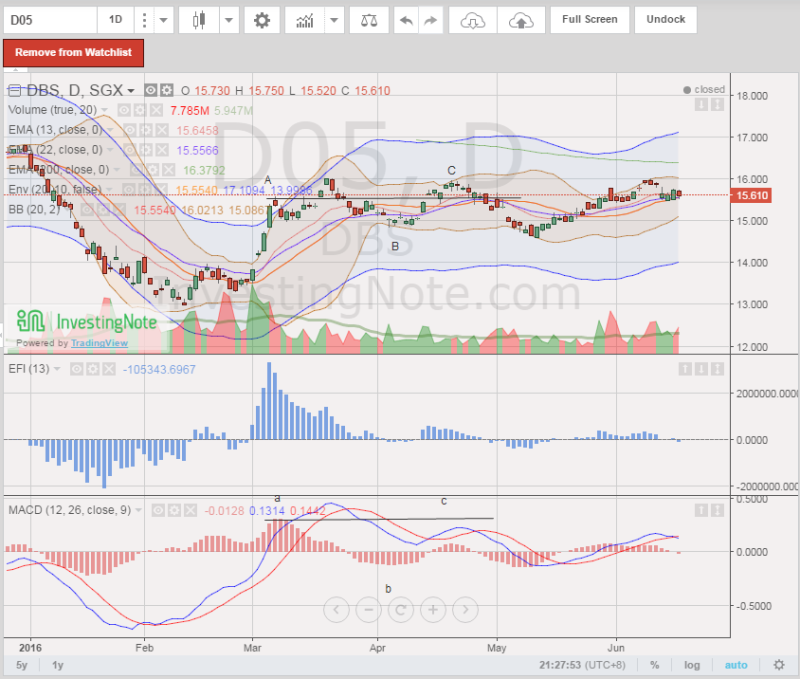
DBS (daily)


Lest anyone thinks it's easier to do divergence, let's present a complex case of a bearish divergence. Here we see three peaks starting from A and ending with C. The second peak is accompanied by falling MACD histogram, which is itself a divergence (though not by my definition). Point C reaches a higher high but not accompanied by a higher point c. This is a complex bearish divergence because it's not the standard A-B-C-a-b-c model, and this is certainly not the most complicated ones. There are others that look like a divergence but it's a fake. Divergence trap, so to speak.

Like investing, it's a science as well as an art, so we do need certain experience (i.e. make mistakes and lose money) to spot and know which is which. I did not come up with this method. Dr Alexander Elder did, so if you want to find out more, go read his wonderful books.