Dow fell another 120 points last Fri, so tmr's quite confirmed is another selldown. It's just a matter of how bad it is.
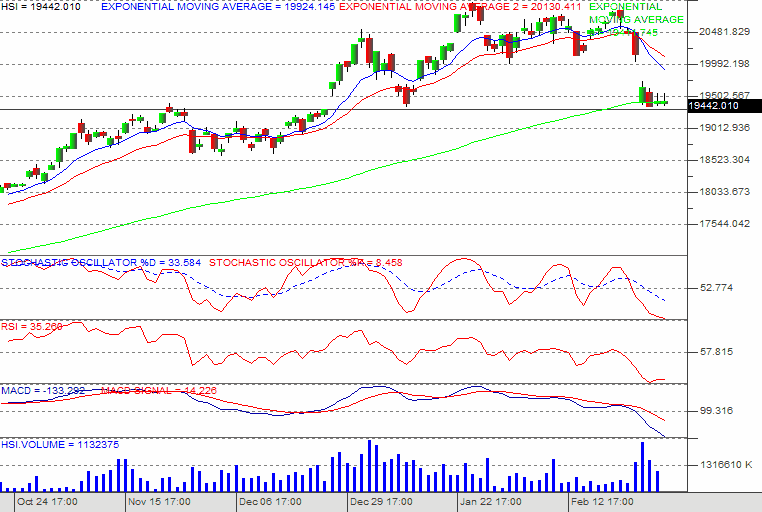
Looking at hsi charts, it only tells me one thing: There's more downside. The green line is ema100. From the chart, we can see that HSI had fallen below ema100 days, so the next thing to look at will be ema200 days. It's still early to tell if ema100 days will act as support, but from other oscillators, it doesn't seem like the end of the selldown. Stochastics is still trending down, with the red line about to make a U-turn. However, blue line is still trending down. Unless monday opens a strong recovery, the chart will still continue to trend down. RSI start to turn up but overall, still bad.
I might get puts.
STI has fallen below ema50 days. The purple line is ema100 days, which should act as support. Basically, I believe more downside based on ALL the indicators. Reading 'the edge' magazine, they said that there's a bearish flag forming with a downside target of around 2800 to 2900 points. That's a level we see around end of Nov last year. Scary huh?
The selldown is broadbased and is with heavier volumes. Do trade carefully.

My total losses now: 27.3k.


0 comments :
Post a Comment