Doing this for a friend. At the same time, practising my charting techniques too.
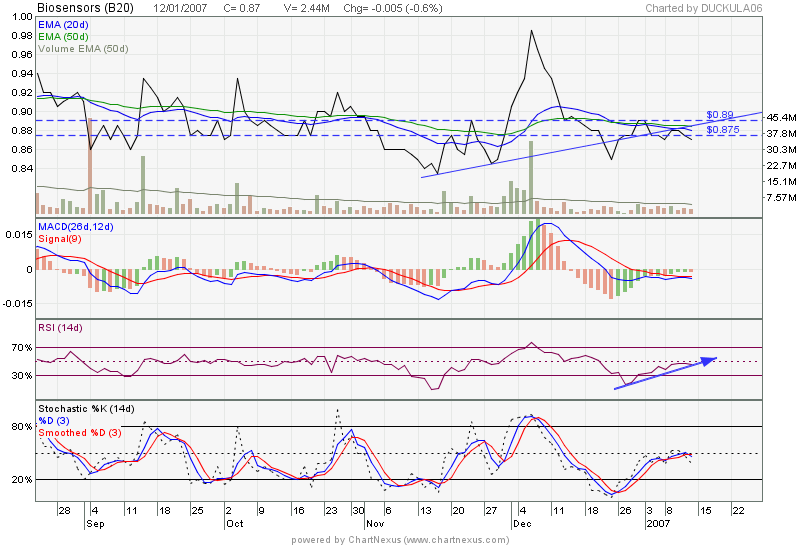
Biosensor weekly chart shows that it is consolidating and not moving up or down. A bollinger squeeze is already in the making, so I should expect very strong movement up or down. It has been consolidating since july last year, so any movement will be a big one. The problem is deciding whether it's up or down. Looking at weekly, stochastics seems to have reached the bottom, so downside risk seems limited. MACD has been trending upwards since Aug last year and rsi is very near 50% mark. I think the probabily of a strong upside is more likely than a downside.
Daily chart - near term resistance at 0.875. Should it break, we should see it coming to another resistance at 0.89. Bullish gravyard doji sign spotted, going to need a white candle stick tmr to confirm uptrend. But it might not be a strong sign. Bearish short term charts, but it could be because it is consolidating, so it will fluctuate up and down till a direction is confirmed.
I do not know when the result is out, so maybe can wait till then before selling. Wait a week or two, if it drops sharply, breaking a rather weak support at 0.86, run first and run fast. For more upside, wait for it to break 0.875 first, then 0.89.
Global voice
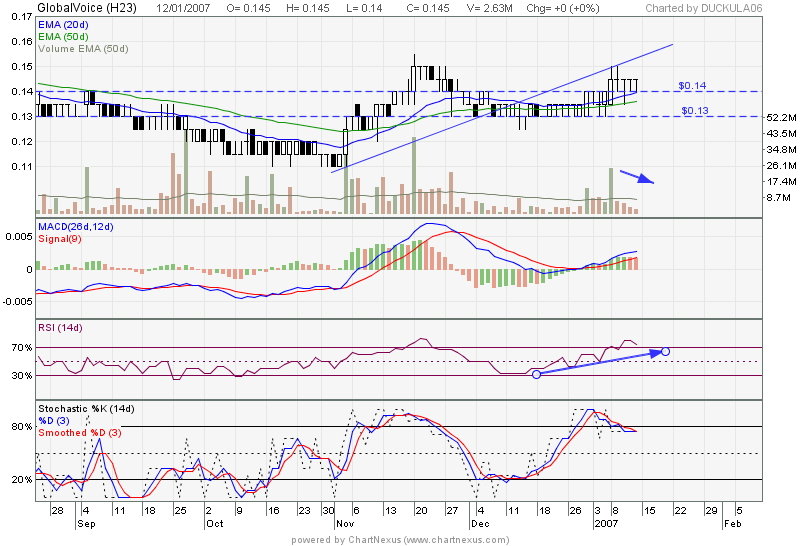
Global voice weekly and daily charts looks good . Daily wise, short term retracement is expected but still on uptrend, so no worries. I expect it to retrace to strong support at 0.14, next level at 0.13. As I said, shouldn't be a cause for concern unless it goes below 0.13. Next resistance at 0.15, once it breaks, cheong!


0 comments :
Post a Comment