Monday, January 15, 2007

Ellipsiz looks a bit worrying

Had a wonderful trading day today.

Did all I had to do, nothing more nothing less. Both stocks that I bought, longcheer and ellipsiz are doing well, especially longcheer. Looks ready to break resistance. Ellipsiz a little worrying, because throughout the day,I saw it trying to break free of the 0.785/0.790 area, eventually closing at 0.79. Hopefully all the sellers at 0.79 are cleared and it can get ready to cheong up to 0.825 and above.

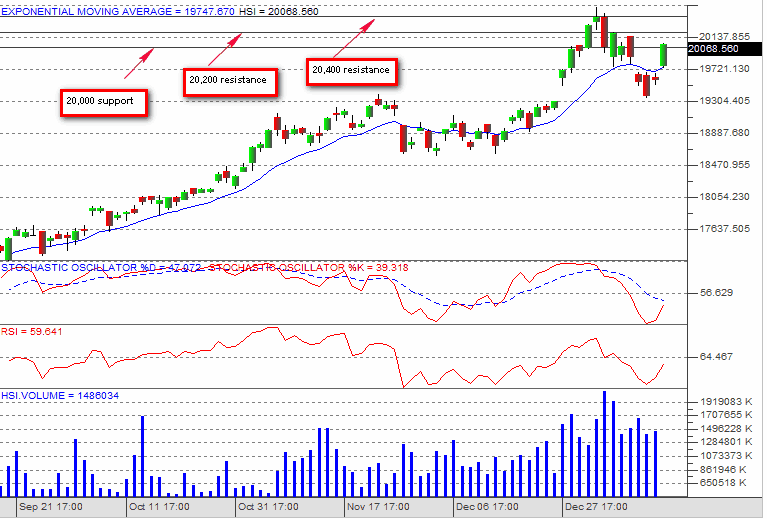
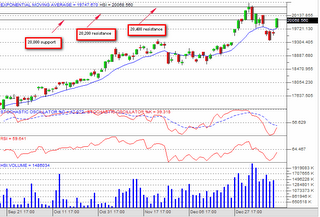
HSI went crazy today. Possibly the very last surge of energy by speculators, pushing it past 20,000. 20,000 should act as a support (should be a weak one) and the next target to aim for is 20,200 then 20,400. Then it'll be in no man's zone because nobody will know what to expect already. For now, hsi looks very bullish with all the indicators pointing for more rise. I'll be looking at call warrant tmr.


Tmr I'll look at my stocks holding carefully for signs of weakness, esp. for ellipsiz. If anything goes, I might be looking to sell off ellipsiz because the run up don't look very strong to me. I might be wrong.

I decided not to post my daily total returns anymore. It can affect my psychology and made me too greedy. I'll post it every weekend though for recording purpose. Keep up on the disciplined approach to trading!
Lunch time thoughts for the day

Today I started out feeling very sure of what I wanted, having done my homework last night.

Talk about my favourite longcheer first. Opened at 1.24 but I didn't jump in to buy because I'm not sure of the volume and strength yet. Due to dow's last fri surge, there will be morning reaction until around 930am or later. So bought 5 lots at 1.23 around that time. On hindsight, I would have bought after hsi opens and pull back a little. Around 11, longcheer went down to a low of 1.21 and it represents a very good entry point because it is so near to support at 1.19/1.20. I totally forgot that china stocks in singapore is also highly dependent on hsi's outlook too. I'll bear that in mind.

So far, longcheer staying at 1.23/1.24, trading at 1.5 million volume. That's half the average volume already. I want to see longcheer trading above 1.24 at a volume greater than 3.57 million. With hsi surging upwards after hitting 19,700, I think should not be a problem.

I also bought ellipsiz because macD histogram shows a good entry point. I bought 5 lots at 0.795, another 5 lots at 0.79 to average down. Support at 0.79. Resistance at 0.82, next higher resistance at 0.835 (strong resistance). Cut loss trigger at 0.78.
Risk reward: 187 to 362 or nearing 1:2.

A more conservative risk/reward is 187 to 212, or 1:1.1

I want to see ellipsiz closing above or equal to 0.795 at a volume higher than 2.4 million. Now it is at 0.79/0.795 trading at 1.3 million volume. Reached an intra day high of 0.805. Since it opened at 0.805, and covered the intraday gap already, I think it should go up from there now.

Tonight dow not opening, due to martin luther king's day or something, so nobody to disturb our mini run day. Nikkei opened strongly, at 170 now, so hsi should be too bad. Hsi might encounter resistance around 20,000. If it breaks, cheong ah!

Sunday, January 14, 2007

Other charts analysis

Other stocks analysis

Doing this for a friend. At the same time, practising my charting techniques too.


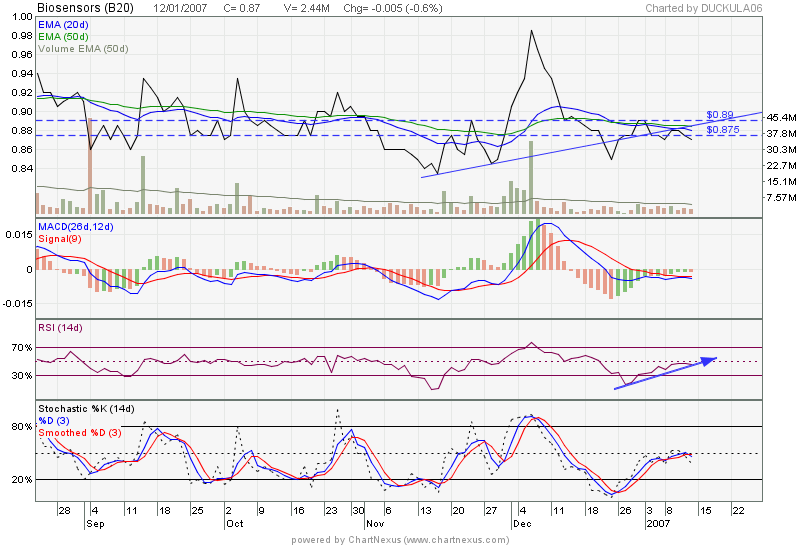
Biosensor weekly chart shows that it is consolidating and not moving up or down. A bollinger squeeze is already in the making, so I should expect very strong movement up or down. It has been consolidating since july last year, so any movement will be a big one. The problem is deciding whether it's up or down. Looking at weekly, stochastics seems to have reached the bottom, so downside risk seems limited. MACD has been trending upwards since Aug last year and rsi is very near 50% mark. I think the probabily of a strong upside is more likely than a downside.

Daily chart - near term resistance at 0.875. Should it break, we should see it coming to another resistance at 0.89. Bullish gravyard doji sign spotted, going to need a white candle stick tmr to confirm uptrend. But it might not be a strong sign. Bearish short term charts, but it could be because it is consolidating, so it will fluctuate up and down till a direction is confirmed.

I do not know when the result is out, so maybe can wait till then before selling. Wait a week or two, if it drops sharply, breaking a rather weak support at 0.86, run first and run fast. For more upside, wait for it to break 0.875 first, then 0.89.


Global voice


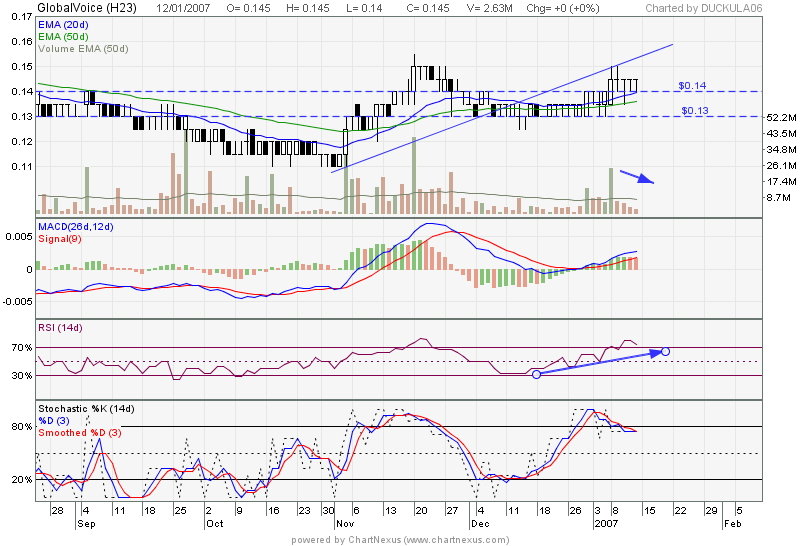
Global voice weekly and daily charts looks good . Daily wise, short term retracement is expected but still on uptrend, so no worries. I expect it to retrace to strong support at 0.14, next level at 0.13. As I said, shouldn't be a cause for concern unless it goes below 0.13. Next resistance at 0.15, once it breaks, cheong!

Saturday, January 13, 2007

Longcheer analysis

Longcheer analysis


Learnt a few neat trick, so going to try it out on longcheer now.

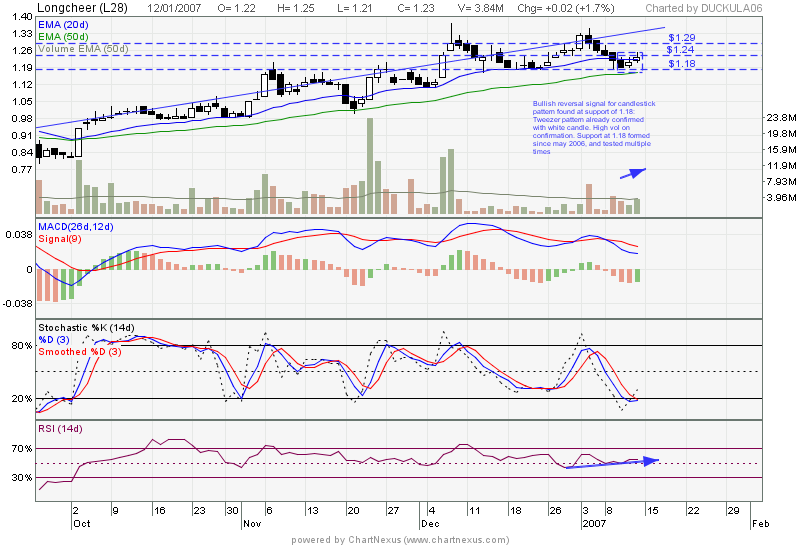
I drew a support line way back from mid 2006 at 1.18. Since it has been tested multiple times, I'll say this is a good and significant support. Longcheer has tested the dynamic resistance provided by the trendline (slanted line) and pull back all the way near support at 1.18/1.19. Look at the candlestick pattern, it is a tweezer pattern confirmed by white candle with high vol. on 12th Jan. Currently, it is closed at near term resistance of 1.24. Should it break this near term resistance, it should also have broken the ema20 days convincingly for me to believe that longcheer is on the uptrend again.

MacD histogram shows a green histogram with both lines above 0, after a period of 5 red histograms. To me, it is a sign that bottom has been reached and selling should have been finished. Ideally, both blue and red lines should be trending upwards but i guess for short term it's okay.

Stochastic look excellent, %K between below 20% and rebounded upwards, exceeding both %D line. More upside to come till it reaches the 80% mark.

RSI starts to look more like an uptrend now, and it recently tested support at 50% and rebounding from there. A short term upside is to be expected.

This is what I'll do. Monday, I expect it to gap up, so I'll buy some, preferably at 1.23 or lower for intraday. As long as it closes above 1.24, I'll be sure of more upside. Support is at 1.18. I'll risk 0.05 with a potential reward of reaching 1.29(next resistance) to 1.35/1.36 (trendline resistance). So that's a risk/reward of 1:1 at least. I'm willing to risk $500, so it works out to be 10 lots.

Before anybody buys, let me warn this: weekly chart don't look safe. Looks like it will hit lower within next 2 weeks to 1.18. But short term is good.

After all the analysis, will I suffer from analysis paralysis? Nah...i'll buy 5 lots first to test my analysis. If successful, i'll be confident to follow my analysis. Risk $250 to earn at least $250 (could reach up to $600) shld be good risk management.

IMPT:
Entry point : 1.23/1.24
Cut loss : 1.18 since it's such a strong resistance (tested 3 times) turned support (tested 2 times) that spreads over 3 months

Friday, January 12, 2007

TR: neg. $6k

I'm still sitting on the sidelines watching because I can't trade.

Let me share with you my analysis on longcheer and hsi. Let's do the Longcheer first.


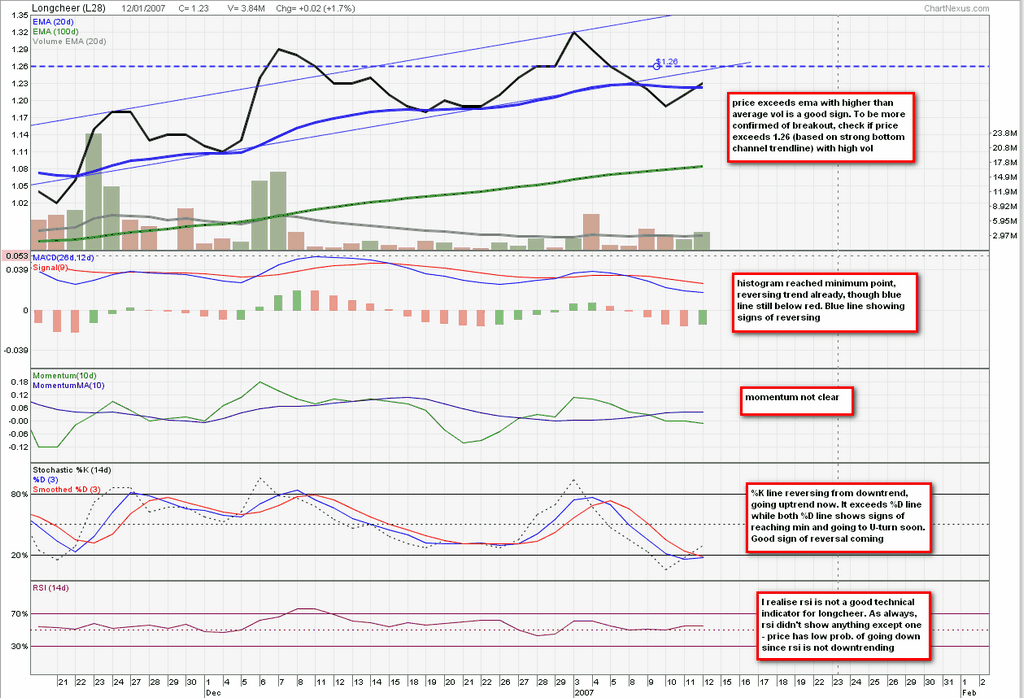
Longcheer has completed its exhaustion gap. What's a exhaustion gap? It exists when a stock keeps going up and up until it runs out of buyers, so there's nobody to push the price up anymore and it'll drop. It will drop below the trendline on low volume then resume its uptrend when it has rested enough. Looking at the price exceeding ema20 is not good enough for me. It must actually exceed the bottom of the channel trend line with heavy volume in order to classify it as a genuine breakout. The bottom channel trend line is significant support turned resistance line because of the no. of occasions the stocks rebounded from it and cheong after it broke out of it, so this breakout (if it happens) will be something I'll look out for. 1.26 will be the target to aim for in the next 2 trading day. If it fails to exceed with heavy vol, run.

Histogram shows sign of reversing. It has reached the bottom and is now on the uptrend, even though blue line is still below red. Stochastics - %K line exceeds %D line and %D line shows signs of reaching the bottom. Downside risk is very low.

Conclusion: Look out for breakout of bottom of channel trend line at 1.26 within the next 2 trading days. Look out for higher than average vol. when it breaks to confirm that it's a genuine breakout. Indicators are mixed, hard to say what will happen. If it fails to break 1.26, prepare for more downside. Quite unlikely though.


HSI analysis


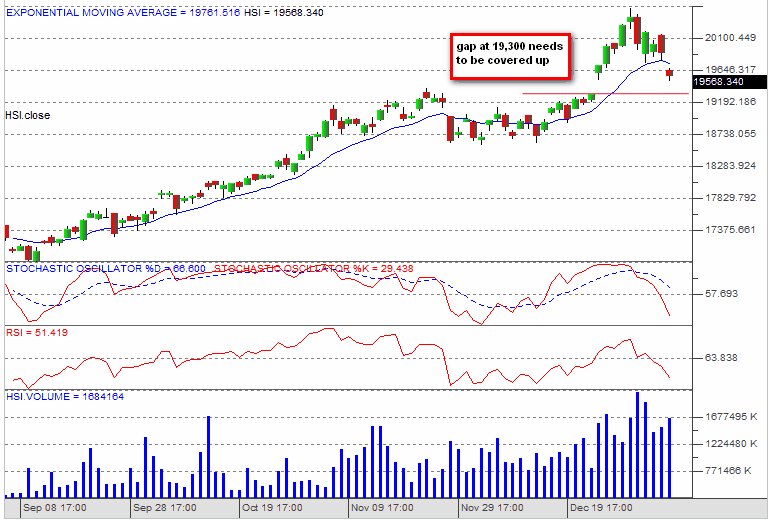
Today it went up around 260 points to close at 19,613, effectively covering the gap it had around mid-early dec at 19,300. Once the gap is covered, there will be room to go up. To confirm uptrend, look out for price exceeding ema at around 19,700 with heavy volume. If it fails to reach, can get ready to buy put warrants again.

Stochastics - %K reversing its downtrend, going up, while %D line shows signs of slowing down its downtrend. Whether it has reached the bottom is too early to tell. Basically, it could reverse from here or go down. My bet is it'll go up.

RSI bottomed out and going up from here. Should see more upside.

Volume seems to be diverging from price, meaning that while price increases, volume drops. A bearish sign, though it's too early to tell. Must wait for a couple of days more to see confirmation.

Conclusion: Simple. If it breaks 19,700, buy calls. If it fails to break, buy puts. Even if it breaks, upside is quite limited since stochastics is at the middle, so before it can rise more, it must and will drop once it reaches the top. But the same goes for downside. Seems like more indicators are supporting the fact that hsi will break 19,700 then not. I'll bet on calls or buy nothing at all.


Market seems good today, though I'm not around to monitor closely. Longcheer went up by 0.020, bring up my total returns.

TR: neg $6k

Thursday, January 11, 2007

Reflection of my costly mistake

I'm on the sidelines watching today.

I can't trade cos my contra loss exceeded a certain percentage of my trading limits, so until I paid off my losses, I can't do a buy in. But I can't pay until they bill me right?? According to my experience, it might take 2 to 3 days. Good time for a break lah anyway..

I took the opportunity to do some studying of hsi. Last time, I bought warrants without looking at overall market trend and betted against the trend. Trend is my friend, if I buy against the trend, I'm bound to get small profits and huge losses, which is exactly what I did. My wins are 100, 130 but my losses counts in the thousands. This is because while hsi reverses its uptrend, I still bought call warrants. This is betting against the trend, a doomed outcome is ensured.


Look closely at hsi monthly charts. Ema has clearly reached the maximum point and is reversing towards a downtrend. Look at the stochastics - both lines going south with the red %K line below the blue %D line. No sign of reaching its bottom yet. Look at the rsi, it has been trending downwards when it reached its peak, again no sign of bottoming yet. Look at the volume divergence, the volume actually increases when it downtrends, a sign that selling is heavier and heavier. All of these indicators point towards at least a short term downtrend in hsi, and YET I BOUGHT CALL WARRANTS!

Goodness, I didn't even bother to read this monthly chart when I bought. I just looked at the highest volume in sgx for warrants, looked at nikkei and dow to see if its positive. Positive, buy call. Negative buy puts. Life is so simple?

I'm glad in a way that my losses helped me to realise this fatal flaw in my trading. If not corrected now, it could lead to even greater losses. That's the magic of trading. Every mistake, if u learn it well, provide a vast opportunity to learn things the hard way. I don't believe after falling here and there for another 5 years I can't be a better trader.

Notice that there's a gap up around early to mid dec? According to technicals, all gaps need to be filled up (except certain cases). Clearly, hsi is reversing to cover the gap, otherwise it will not move up. My belief is that hsi will cover the gap within this week, while all the indicators would have reached the bottom already, and will resume its uptrend from there. While there is more downside risk now, it is limited. The gap is at 19,300, so it should go down to there and trend upwards. When it reached 19,300, that would be an excellent time to buy call warrants again. For now, if there's a day when hsi goes up, put warrants is an attractive buy.

Do I regret losing all these hard earned money? No. If I learn the ropes properly now, this will be more insurance against any kind of employment situations. Even if I'm out of job, I can still rely on this to give me some kind of income. I hope at that kind of age, I'll be a savy investor to really not working anymore but trade daily. What better time but to train now?

Good courage breaks bad luck!

TR: neg. $6.8k

I heard a lot of pple kena killed today in the market.

The sudden and vicious drop in shares price caught many unaware, including me. I didn't expect hsi to continue dropping for 3 consecutive trading days. Almost wiped off 600 to 700 points in 3 days. That's like crazy..

Not in a mood to discuss more. I'll just say when I think about longcheer.

Longcheer dropped another 0.030. All expected, though the magnitude of the drop isn't what I expected. But the selling is on a decreasing volume so I think shouldn't be a cause for concern. Stochastics dropped below 20%, quite rare for longcheer. So the next level to look out for reversal will be when %K drops near to 0% level. To cut the story short, I think still have a little more room to go down before it rises. As long as the price don't drop below green ema100 days, I think really no cause for concern. Btw, 5th straight consecutive day of dropping already.

TR: negative $6,8 k

Wednesday, January 10, 2007

Painful lesson learnt

Painful day for me..

Cut loss at .049 after hsi opens. Made a loss of 5.3k. My most heavy loss ever!
This lesson must be learnt sooner than later: CUT LOSSES PROMPTLY

Today is a bloody red day worldwide. Almost all the Asia pacific bourses fell. I'm talking about quite a major correction, not those little tiny correction. Has it started already?

Thailand is really screwing everyone in asia. Everytime they do this kind of control in their control, the world's market crashes. First was the asian financial crisis in 1997, then last year dec, then now again.

Another thing I learnt was that if the contra losses are a certain percentage against your limit, you are barred from entering any more buys. I'm at this point now, so until I paid off my contra losses, I can't be trading. Which is good, cos I think i'll take a break for now.

Yellow page final reached it's parabolic blow off point, it fell very sharply by 0.18. Luckily I did not chase this stock otherwise would be in deep shit now. This kind of sharp rise (been rising everyday for past 7 consecutive days) is simply unsustainable. Longcheer fell slightly too, now at support 1.19/1.20. Shouldn't expect it to fall lower.

Total returns as of now: a very disappointing neg. $6.7k

I'll update more tonight of today's bloodshed day.

Tuesday, January 09, 2007

Longcheer analysis

Longcheer analysis


I pretty much said it in the charts already.

Time to weigh the evidence:
1. It seems like price did not rebound off trendline today, so a possible exhaustion gap is in the making. Which is one of the scenario that I said might happen yesterday. If it's an exhaustion gap, then I think price will go down further, reverse, then cheong past the trendline and carry on the uptrend from there. Looks like more downside to go, but should be a weak one.

2. MACD histogram shows more downside. I have not seen a histogram with just one histogram below the 0 line and go upwards from there. SO, I think should go down, hopefully a little tmr, finish the downtrend next 3 days (min) and go north of 0 line from there.

3. Hard to say what momentum will do. Might rebound off momentum MA line, or might go below more then rebound. Each way is equally possible, so can't tell what might happen tmr from this indicator. A good sign is that the blue line is confirming its min. point and u-turning. A bullish sign that a reversal is about to come soon.

4. Stochastics - based on history, longcheer's stochastics seldom go below 20% line. So tmr, %K most likely will not breach the 20% line. What this translate is that a little price drop might be seen, if not, U turn immediately tmr. 2nd scenario not so likely because all the lines don't show signs of reaching min. yet. What I think is that %K line will go slightly below, show a convincing turn from its downtrend and pull the %D lines up from there. Might need a few days to see this happening.

5. RSI not clear yet. What is clear is that RSI is going flat. At least its not going downtrend already because it had completed the "higher lows" of the trough and peak theory.

Conclusion: Longcheer is about to reverse its downtrend, should expect it to happen in next 4 trading sessions (to be conservative), baring any unforeseen circumstances. Most likely tmr will see a weak drop because most of the indicators are showing signs of that. If not, it will cheong and breach the trendline, probably hitting a high of 1.34 in 4 market days (not likely).

A very good time to start accumulating in small amounts now to anticipate the uptrend which can happen anytime soon. For me, I'm stuck in some warrants, sigh...

Dow positive as of now, hope and hope and hope it'll close positive. Then tmr will have less reasons for hsi to plunge. Good luck to me!

Why could'nt I cut losses?? TR: neg $2,850

Hmm, wonder what's wrong with hsi.

In the morning, evryone is rushing to buy call warrants. The price shot up even before hsi opens. But within a few minutes of market opening, it crashed down and never really recovered.

I bought 15 lots at 0.665 and another 15 lots at 0.660 before hsi opens. If I sold off before it opened, i'll have made a good profit. Greed greed greed is the downfall of many, including me. I thought hsi would stand a good chance to recover from yesterday's fall but nope, it fell even another 130 points.

This caught me by surprise. Everywhere in the world, almost all the markets are positive, including those in asia pacific and europe. But just not hsi. Hsi seems to diverge from the rest of the bourses and this is why I'm surprised by this sudden turn of move.

Another thing is my cut loss. I thought i was disciplined, but I think I got a million years more to learn about cutting losses promptly. Haven't I realised that if i cut losses promptly, I wouldn't even incur that hefty 18k losses last year? I wouldn't have incurred a 2k loss today too. One of my heaviest losses in warrants, i must say.

I thought about cutting losses later but waited the whole day, and not find a good opportunity to do so. I decided to keep it overnight. I seldom do this but I think it's quite a good rewards/risk.

Reasons?
1. Dow futures +34 as of now. It's nothing to take note because at most this means dow will open positive. Closing price is more impt.

2. Looking at europe and japan, they all closed +ve. This could be a better indicator of dow tonight to close positive.

3. I am hoping some of the enthusiasm of China life A listing in shanghai would rub onto hsi tmr

4. Hsi closed negative for 2 consecutive days already, knocking down nearly 400 points off roughly. So tmr should be a good probability of a technical rebound. Cannot everyday fall right, not in a bear market yet lah.

I'm also quite pleased to see a surge of pple buying the warrants nearing closing time. It drove the price up by 3 to 4 ticks. Could be anticipating a gap up tmr.

If all that i said didn't come true, esp if dow closed negative and nikkei too,I'll sell before hsi opens. I will have around 1 hour to do so. CUT LOSSES PROMPTLY!

Somehow I'm not very worried about holding this warrant overnight. Dunno why. Had prior experience, almost can't sleep, but not this time.

Longcheer went below support of 1.20 to reach intraday low of 1.18. But bounced back to 1.22. If looking at the closing price, i would say longcheer's day of decline is over. This fits into my analysis of an exhaustion gap before it rises again. Will be doing more analysis tonight. Tmr should be looking at either a slight fall if not a rebound to breach the dynamic support level provided by ema20 days.

Blog more later.

Total returns for the day: negative $2,850

Monday, January 08, 2007

My amateurish longcheer analysis

This is my attempt at predicting price movement. Pls don't attempt to follow this, caveat emptor!


Longcheer

Longcheer is going to touch the bottom channel trendline. This trendline happens to be the ema20 days and it had been tested 3 times as shown in the chart. SO, it should be a significant dynamic support line and I believe it should hold. A possible alternative is that it might go slightly below and whip back up on what is known as an exhaustion gap. Both will still be a bullish sign.

Longcheer's most recent price decline is followed by low volume, so it's a good sign. Why? It means that sellers are not in full force, because if they are, the price decline will be followed by substantial volume. This decline is probably due to lack of buyers.

MACD...not good in this but i'll try. Looks like more downside to come as the MACD is crossing down the signal line. But if you look closely, signal line is reversing its downtrend. A likely scenario is that MACD will hit signal line and bounce up from there. Momentum chart is the same analysis as MACD.

Stochastic don't look good, more downside it seems. %K line slowing down its downtrend but still far below %D. Looking at the past, %K line will likely hit 20% support line and rebound, but there's still some distance to go before hitting 20%. A much more likely scenario would be the exhaustion gap I mentioned earlier instead of the rebounding off ema20.

RSI is more vague. Half a reversal signal is shown. A reversal to the uptrend is shown by higher highs and high lows, so looking at the chart, it seems there is a new but higher low in the making. If rsi goes up from there and shoot above the peak, it will validate the signal.

Conclusion

Loncheer have more upside to come. Tmr is a decisive day to see if the scenario is an exhaustion gap or a rebound off the support line. If you have good risk appetite, buy now. If not, can wait (like me) for double, triple confirmation before buying.

Total returns: negative $520, made 500 on put warrants

Later in the afternoon, I went in for another trade. This whole day, I've been buying puts and not calls because I feel that the general direction of hsi today is down.


I bought and sold my put warrant in less than 10 mins to earn around $70 more. The money is not the point, the experience and confidence gained in following your analysis is the ultimate gain. Let's look at the reasons for the trade:

1. I bought at the blue arrow. At that time, ema finished its peak and is going downtrend from there. Furthermore, hsi price went below ema trend line, which is a bearish sign

2. Looking at stochastics, the %K line and the %D line had peaked and had gone down. It would be better to buy a few min earlier when they are at their peaks, but as I've said, today i'm not in a mood for aggressive trading. So, I waited for the downtrend to confirm before jumping into the trade. The downtrend in stochastics is confirmed decisively by the steep gradient, which means it's not likely to rebound. Notice %K is below the %D line, another bearish sign.

3. RSI had recently peaked. As in stochastics, it would be a better idea to buy puts at the peak but I would wait for confirmation before trading (for today, haha!). Confirmation is by the fact that rsi trends down (steep gradient somemore) and doesn't show sign of reaching its minimum and U-turning.

4. This short interval of time presents one of the best opportunity to buy puts because all the signs points that hsi will go down. RSI trends down, stochastic trends down, %K below %D, ema reached peak and turning down, price below ema. The probability of failure in this trade is actually very low. I jumped in with 20 lots straight.

The problem comes with my selling. I was bugged by the fact that dbs website is not stable, so rather than wait for the correct sell signal, I jumped the gun and sold sooner than I would have in better environment (connection wise). If you notice, I sold immediately when %K rises a bit from its minimum, and rsi rises a bit while on is downtrend. More imptly, I looked at the hsi price. The price is almost going to test the ema trendline (which acts as a moving resistance). The gear ratio of my puts is low, so rather than risk more downside to hsi price, I sold off my position and ended my trade there and then. It later rose up to 0.295, BUT I thought I took a good analysis of my rewards/risk and concluded its not worth the effort. No regrets there even if my puts price rose further.

After my expensive 1.6k lesson last week, I was in a better mental state. I'm very cautious, looking for confirmation after confirmation before trading. I keep taking stock of my mental state before I go into a trade: am i tired, desperate to make more money, crazy?

Analysing today's charts, I drew an important conclusion. The best time to make the trades would be the green arrows A, B and C. These represent a very strong probability that hsi price would go downhill (which it did), for reasons I mentioned earlier. I did wanted to get into puts at C but again dbs froze and I waited for like a min or 2 before deciding it's not worth it anymore. Opportunities to buy, if passed, will come again and there's no need to fulfill a trade because the situation would have changed in a matter of seconds for warrant trading.

All in all, an excellent trading day in terms of learning value. I earned $500 today in warrants. Overall, longcheer fell (which I think is good so as to touch the support line and fly from there) and dragged down my earnings a fair bit. Pac andes fell too. Yellow page went mad and jumped 0.070 to 1.38. Utterly crazy!

Total returns: negative $520

I heard tmr china insurance is listing on hsi. Should be having a strong rebound tmr. STI should rebound back after dropping 30 points to a nice 3000.00 today. Dow futures is positive. Call warrants, anybody?

New stuff: charts reference!!

I learnt from my lesson last week. This time I'm going to be even more serious in my postings, in order to benefit fully from writing this blog. I've downloaded a free screen capture software and I'm going to post down the screenshots of the charts I used so as to act as a future reference for my trading. This is also to understand better why I did the trades.


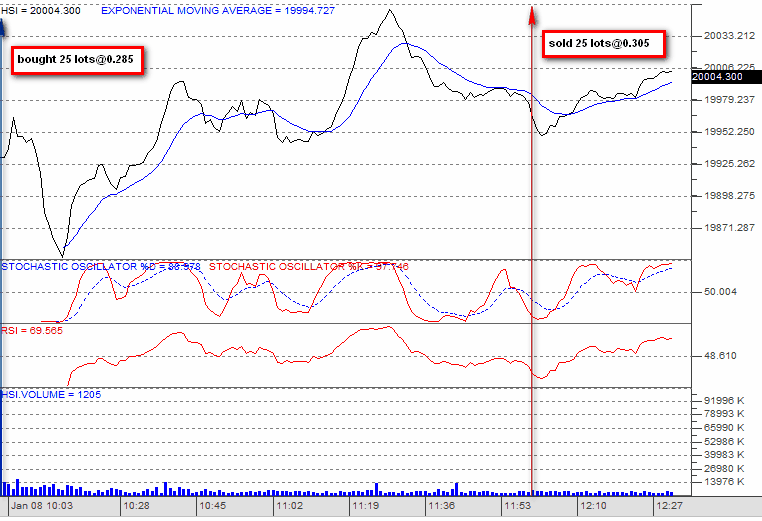
Since dow closed negative 80 last fri and nikkei is on holiday, I bet that hsi will open negative. This is knee jerk reaction from dow selldown. SO, before market for hsi opened, I bought put warrants for hsi. True enough, hsi fell sharply. But you know what? DBS HUNG UP ON ME AGAIN!! This time it's so serious that I can't even log in for around 15 to 30 minutes!

Goodness...luckily my put warrant had low gearing, otherwise I would have been killed there and then. It went up to a high of 0.32 before hsi rises up. Sigh, otherwise would have made close to 900 in the morning. Too bad, shit happens.

I placed several bids to sell off at 0.310, 0.305 and 0.300, before settling for 0.305 at 12 noon. The reasons for my selling can be seen from the chart:

1. Stochastic oscilator %K is finishing its minimum curve and is going to reverse. In my aggressive and risk taking mode, I'll wait a little more before I sell. However, the put warrant I've got don't react to minute changes in hsi, so I thought the rewards of waiting for another tick up is not worth the risk if it suddenly cheong upwards after %K reverses trend.

2. RSI also undergoing reversal, almost finishing the minimum curve

3. HSI price seems to have more downside, but I believe in charts more than the actual price, so there.

4. Quotes for selling is around 0.30/0.305, with the next bid up at 0.310. I tried one whole morning to sell at 0.310 but failed. I'm in a risk averse mode, so I thought I'll bid at the next bid at 0.305 and get out. Furthermore, if the website is down again, I'll be screwed big time. God knows what will happen in the afternoon.

So I sold off. The price never hit 0.305 again, so I'm glad I sold off at the high around that time. I'll decide whether to go in again in the afternoon. HSI is getting very unpredictable.

Yellow page cheong again, crazy stock. Is there really something going on? I hope longcheer will fall a bit today to hit the ema 20 days support line, so it can really cheong all the way up to cover the gap at 1.37. Will see how it goes later.

So far made $440 on warrants. Total returns at lunchtime: negative $190

Saturday, January 06, 2007

Earnings nosedived to negative $620

Okay, bad trading day extends over to dow too. It is now around -80 plus. I hope hsi direction would be clearer on monday. I hope it's a day for put warrants.

Reflecting on the afternoon's episode, I think I'm getting greedy. There are chances where I could have cashed in on my warrants and earn some money, but I kept thinking just one tick more. This is irrational. Next time, I'll try not to be greedy, it's just something that I have to fight back everytime.

Most important of all, do not put more money when the bet is wrong. JUST CUT LOSSES! It's so easy to say but so difficult to follow. CUT LOSSES, CUT LOSSES before they snowball! Must learn to take the pain of cutting losses. This calls for a lot of discipline.

Yellow page seems to have gone mad. For the past couple of days it has been rising up. I wonder what's the big accumulation of yellow page for? Pac Andes expectedly went up because its subsidiary china fish acquired more and more fishing supertrawlers. Longcheer went down further. But knowing longcheer characteristics, I'll say it's normal. This stock has a habit of cheonging when nobody's expecting for 1 day, then fall again before repeating. I think it have to cover the gap before it can cheong again since it gaped to 1.37. So, I think it still has some more distance to go before the gap is covered. The highest point reached recently is only 1.35. 1.37 should be the resistance to overcome.

My total returns nosedived: -$620
(due to my stupid warrant episode..and the spiraling down of longcheer)

I'll reflect on the trading i've done for this week, perhaps tmr or sunday.

Friday, January 05, 2007

Very very bad day

Bad trading day.

Could have earned 100 plus dollars and ran away feeling happy, but I traded more and lost even more. Sigh...

1. Buy 10 lots at 0.675
2. Sell 10 lots at 0.695

3. Buy 5 lots at 0.67
4. Buy 5 lots at 0.68
5. Sell 10 lots at 0.67

6. sell 15 lots at 0.705
7. Sell 10 lots at 0.710
8. Sell 10 lots at 0.725
9. Buy 25 lots at 0.75
10. Buy 10 lots at 0.755

It's so painful to type this out.. I could have made some money on trade 1 and 2 alone and leave but no, I acted out of character today. What's worse was trade 6 to 9. I don't even remembered pressing it!! Maybe the computer cock up my orders or something. When I saw the trade I was really panicking, because firstly, hsi was cheonging up while I'm shorting the call warrants. Next, my buy limit cannot allow me to cover my naked shorts and time is running out. If I don't buy back, sgx will buy me for me 3 days later, which might result in catastrophic losses. I'll rather do whatever I can to buy now at a loss that I know rather than wait 3 days for the unknown.

I had to frantically call dbs help line to raise my limits but I think they tried to earn some extra commission because they have to let a broker do the buy back for me. It's another extra 0.10% on top of the 0.28% commission. I said okay resignedly. Small price to pay to stop my losses.

Crazy shit...what kind of mental state am I in today? Tired (didn't had my afternoon nap, woke up early for work, didn't sleep well last night) is the first thing that came into my mind. Bad state to trade...hiaz..

So how much did I lose on the warrants? 1.6k (i overestimate it to include the extra commission charge, probably lesser than this). Totally wiped off all the meagre amount of money that I earn the last 2 days. This is my first loss of the new year, well, I deserved it.

Longcheer didn't do good today either. Dropped 0.030, dragged my profits down somemore. Total returns as of now: -$400. Nevermind, I'll get my tip top mental state back and recover everything again. I shall not be broken by this minor setback.

IMPORTANT LESSON: DO NOT TRADE WHEN YOU'RE NOT IN THE RIGHT MENTAL STATE

Thursday, January 04, 2007

Total returns for a bad selloff day: $1,470

A correction that is due had arrived.

As I type, dow was down 60 points. Tmr should be another red red day I suppose, unless dow wants to make a U-turn in the middle of the night again? A correction now is better than rising all the way and crash down hard.

My stocks got battered hard. Haha, what rose up quickly also fell down quick, like longcheer. Yesterday it was up by 0.060, today it closed down 0.030. Shake off some weak holders to prepare for the real surge, I hope.

Yellow page is a big surprise though. Rose up by 0.040. Really something fishy going on, because yellow pages usually nobody would touch it, in bear raid or bull run. But now, it kept cheonging. Good for me, though for this stock, it's still a -30% loss, haha. Luckily only 1 lot, won't die.

Total returns: $1,470

(considering today is a big selloff day, my stocks didn't drop all that bad, only longcheer drop mildly today. I'm so glad that I sold off all the laggards that didn't rise during the bull's run. Now the bull ran away, they dropped a lot and could have dragged down by portfolio tremendously.)

Close shave for warrants...made $130

Had a close shave today..phew

What a suprise that dow closed only +11. When I slept, it was still hovering around 100 points. A turn of events when fed released their minutes. Hmm... It turns out to be a red red day, except nikkei. STI dropped substantially, almost all the stocks in my watchlist are all negative. My holding stocks included. Longcheer reached skyhigh to 1.35 before falling to the present 1.28. Only one that stayed the same is yellow pages. Not suprisingly, because yellow page is not active too when the bull runs.

The close shave was to do with my warrant trading.

Trade 1: Buy 10 lots at 0.805
Trade 2: Sell 10 lots at 0.820

Trade 3: Sell 10 lots at 0.830
Trade 4: Buy 10 lots at 0.810

Trade 5: Buy 10 lots at 0.735
Trade 6: Sell 10 lots at 0.73

Trade 1 and 2 was the standard buy first, then sell. Trade 3 and 4 was the unusual naked short. What I did was to sell 10 lots at 0.83 first, then go on to buy back (cover back) 10 lots at 0.810. This is the first time I did naked short successful. Previously, it was 100% failure rate. Not too bad eh?

~~~~~~~~~~~~~~~~~~~~~~~~~~~~~~~``
TAKE NOTE: Naked short actually reduces your trading limit for buy and sell by the amount you traded. I didn't know that and it caught me off guard. It resulted in me unable to average down to catch the bottom, nearly did me in today.
~~~~~~~~~~~~~~~~~~~~~~~~~~~~~~~``

The close shave was trade 5 and 6. If you notice, I mistook a signal to buy and went in to buy 10 lots at 0.735. However, the price nosedived sharply. I should have known not to buy! I was already decided to quit for the day but I was tempted to go back in. I had to pay the price for this lack of discipline. Luckily it rebounded slighly back up for me to sell off at a slight loss. Murphy's law happened...dbs hung up on me! I had to spend the next few minutes frantically hoping that I can still sell before it nosedive another round. Luckily all went well and I managed to cut my loss for trade 5 before it got worse. (It did got worse, now hsi dropped 400 points - if i'm still holding my call warrant, bye bye)

Looking at how hsi jumped down really frightens me. Better not get cocky next time and stick to my plans! Had enough for today, not going to trade anymore, for sure! Made a bit from my warrants, $130. Could have made a 100 more, if not for trade 5 and 6. But that's the fee for not being disciplined.

Even as I type, longcheer is spiralling down. But I have no fear for it, cos I heard some fund houses buying longcheer. Married deal at 1.28. So the closing of longcheer today should be somewhere around there.

A very very red sea everywhere. Dow futures is flat, after losing a slight gain just now. Could the inevitable be here now? Somehow, I still don't think so.

I'll update my total returns later tonight, as of now, it's $1,210 (due solely on longcheer losing 0.040)

Wednesday, January 03, 2007

Total returns: $1,920

Wow, sti closed at +52 points, a really roaring start to a new year!

I wonder how sti would fare tmr. More imptly, how would hsi fare tmr? Tmr shanghai, shenzhen, nikkei would open, together with dow tonight (so far +70), so I hope it'll cheong even higher tmr. I'll be home to check out the action till afternoon.

Excellent showing by longcheer made my portfolio gained massively for this first trading day of the year. Longcheer gained 0.060, and I hope it'll carry on the momentum. Short term charts is very positive, showing more upside to come. Pac andes too, short term looks good.

Heard some big boys are accumulating defensives stocks like the yellow pages that I'm holding. Usually pple flock to defensive stocks because market is peaking, so I'll be looking closely. Though some forummers said that yellow page is aggressively seeking new plans for advertisements. We'll see how.

Total returns for today: $1,920

Earned $140 from warrants : )

I didn't follow what I said last night when I wrote that I won't be trading today. The feeling was just too strong to ignore. So, before I went to work, I just bought half my usual size of call warrants and hope for the best.

When I came back, it was slightly negative. Could have made around 700 if I'm around. Sigh, days like these made me think if it's worthwhile to earn $70 in 3 hrs (for work) compared to $700 in just one morning. I stil love my job, but knowing that you could be out there having an easier life earning more money makes me think twice.

After lunch, hsi went downhill but I wasn't that worried. I can't explain why. I was quite confident that it'll rise up so I bought another half of my usual size of warrants to average down, with my average buying price coming down close to the price at that time. This is impt because if you're sure of the direction, average can help you turn a losing trade to a winning trade. The key word here is : "if you're sure".

Using my super doper spreadsheet, I calculate my profits to be $140. Nearing 330pm, I wanted to enter but the stochastics was at the middle, not right at the bottom, which is my usual buy signal. Didn't think that it was worth the risk to enter, especially when hsi would close at 4pm, and I don't want to hold overnight. After fighting the temptation to enter again, I once-and-for-all decided not to enter. Just not worth it to risk what i've earned for what I could have earn. SO, that's all the trading I've done today.

On the whole, the market is crazy! STi shot up 30+ points at this point in time, shows no sign of weakness yet. However, HSI didn't surge up as strong as yesterday. Cheong too much, I think. Today, I saw a lot of stocks increase their price by 0.5 (wilmar), 0.6...it reminds me of last year's may. I rememebered seeing all these great increase in price (and wondering why my stock wasn't like those). Ominous signs indeed. What's more? All the top 10 vol stocks are held by penny, a sure sign of a bull's run end. I'll be pretty cautious at this point in time and will be looking to sell my stocks. I definitely won't be adding anymore, no matter how much they cheong. I've learnt my lessons well. So, this month and next, I'll be doing intraday trading. Holding anything overnight is a big nono, unless circumstances change.

Since sti touches 3030 now, probably might rise a little more before correction. Time will tell if this correction will herald the coming of the bear, but somehow I don't think so yet. Reporting season will be coming up in feb, that'll be an excellent excuse to take profit. And when everyone does that, the inevitable big crash will come. Alright, enough of doomsday prediction.

All my holding stocks went crazy today. Pac andes went up by 0.035, yellow page went up 0.03, and my precious longcheer went up by 0.04 as I'm typing this. In this bull run, if your stock is stagnant and not moving up, or even going down, you got to seriously examine your portfolio. I remembered this lesson clearly in May when my stocks just hover around the same price. It's these laggards that will kill you when the market crashes. In a bull run, if these laggards won't cheong, what will happen when a bear raids?

Of the stocks I'm holding now, I'm thinking of letting go of yellow page. This stock shows the least potential for future growth (when's the last time you ever flip yellow pages for help?). I'll check the charts tonight to look for a good time.

Half an hour to market's close, total earnings: $1,730

Tuesday, January 02, 2007

Total returns for new year 2007 : $420

Had a wonderful new year!

So wonderful that I'm slightly flu-ish from too many outings and parties. However, I managed to do some wonderful stuff to my spreadsheet for my stock portfolio.

First of all, I revamped the entire formula calculator to make it more efficient in calculating. Now, it's much easier and faster to get the bottom line profit/loss. In the midst of doing this, I also found out that I miscalculated some of the buying charge and sell charge of my holdings stocks and did the corrections. It's not much, thankfully, otherwise would have affected my profits. I also deducted the dividends of the stocks that I'm still holding since last year, and add it to the portfolio of the year 2007.

The best thing that I did today was to incorporate an intra-day warrants trading calculator. Though it's mainly used (for me, at least) for calculatiing the consolidated commission if you trade a particular warrant many times a day, it can also be used to calculate other stocks. I believe this nifty little program can help me shorten the adminstrative and lots of detective work after they send me the contra statement saying my gains and losses. I had this problem last year whenever I had multiple trades of a particular warrants for a day because dbs vickers would consolidate all the buying and selling price and calculate the commission from there. It think now the problem would be reduced if not totally eliminated. I'm so excited that this program would save me lots of trouble double checking my statements!

I changed the formula in the spreadsheet by putting in a max/min function when calculating the buying and selling charge of stocks. Last year, I had to physically compare which buying charge is the most and which selling charge is the least, then keying in the right charges to calculate my profit/losses. Now, the new formula will reflect this and choose the correct amount for the calculation of profit and loss. Very nice!

There's a discrepancies in commission because dbs charges 0.28% for internet trading (for trading less than 50k), subjected to a minimum of $25 commission. Sometimes if the amount of shares I buy is lesser, the commission would be just $25. But if I buy a lot of shares, then I would have to calculate the 0.28%. Now it's all settled easily in my revamped spreadsheet.

After testing it in a couple of trades that I executed last year, I'm convinced that my program is bug-free and I'm ready to put it out to work when I start trading this week.

HSI rose 320 points. Wonderful start to a new year, haha! I might not be able to trade tmr as I have work in the morning. It's okay, I'll take it easy this week. Oh ya, I resetted my past earnings for this new year and what I have for my total returns will now be based on the stocks I'm holding and future transactions from this point onwards.

The wise said, "The market is always there, you don't have to trade everyday". This is very very impt, so take note!

Total returns for 2006 (minus dividends and paper wins so as to carry over to 2007)
= $3,500
Total returns for 2007 (added last year dividend for the stocks I'm holding and paper wins)
= $420