This is not a sponsored post. I just think it's a great tool for people to use it, so I'm sharing it. This is also not a tutorial to show you how to use the charting software, but more of how I use the charting software at Investingnote.
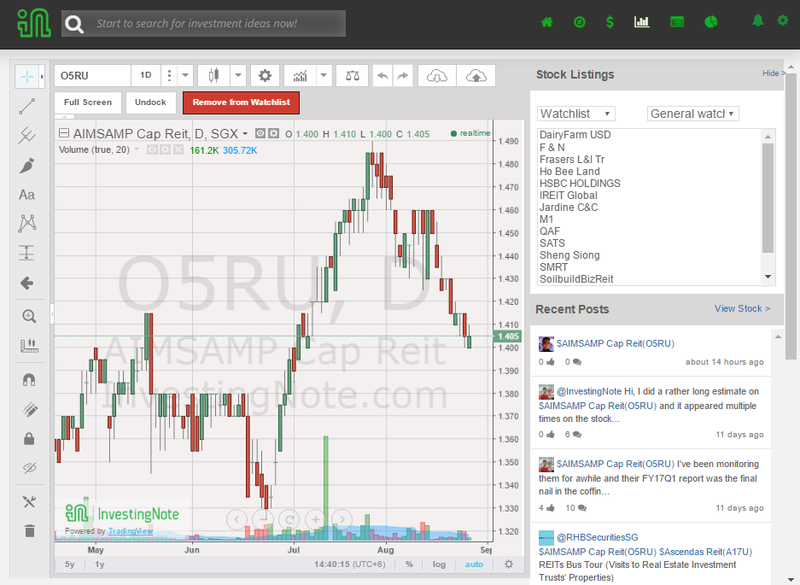
When you logged in and click on the "Charts" option on the upper right corner of the platform, you're going to see something like this screen:
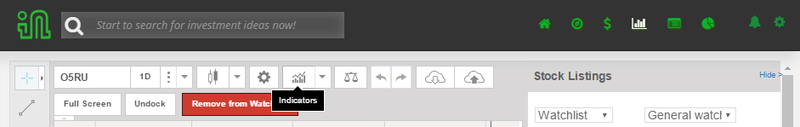
I like to add a few indicators to my chart. I mouse over the symbol with the charts, and you'll see "Indicators" appearing.
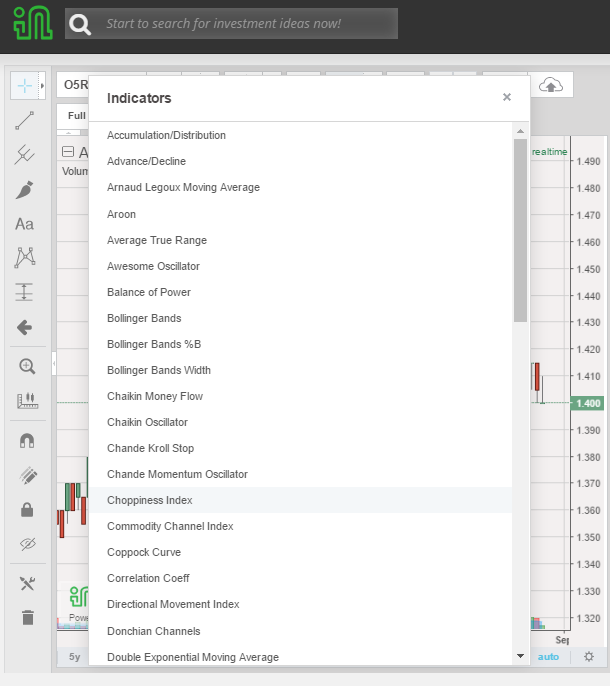
Clicking on it will bring you to the list of indicators available for you to add in. I proceeded to add in MACD, Elders Force index and Moving exponential by clicking on the names. It'll automatically be added to the charts.
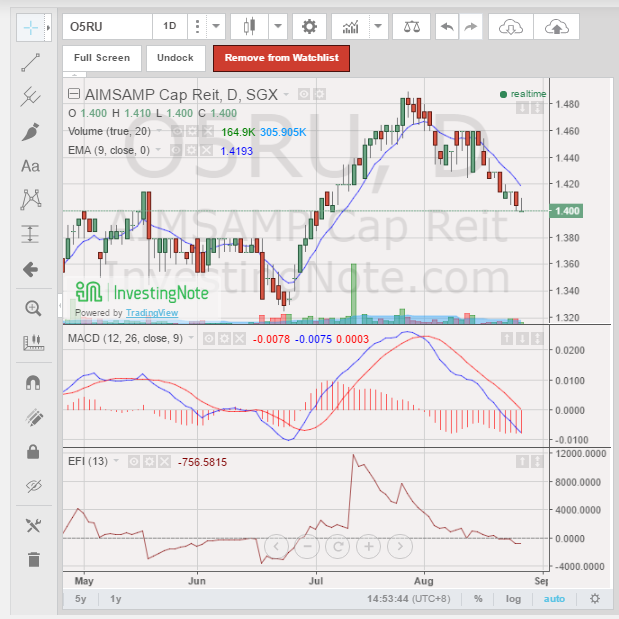
Now my charts look like this:

Play around with the options. I changed the colour of the plot to blue, line to histogram, and thickened the width of the histogram, as shown below:
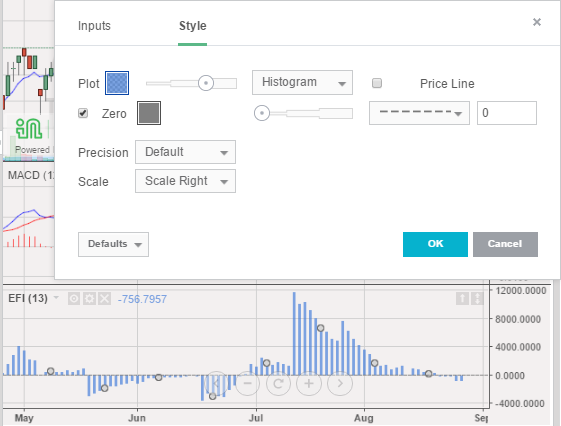
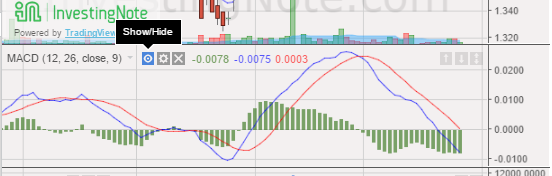
If you're satisfied, you can click OK and it'll be shown on the chart. I did the same format adjustment to MACD too. Let's say you don't want to see the MACD appearing, you can hide it by clicking on the first icon next to the indicator:
You can also shift the order of the indicator up or down. Let's say I want to move my MACD indicator right at the bottom of the chart. I'll press the down button on the top right corner of the indicator box:
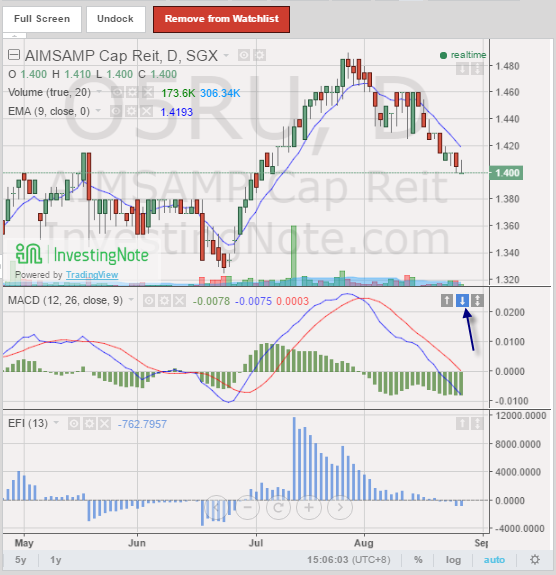
Once you've pressed it, the indicator can move up or down according to your liking. You can also draw trendlines, horizontal support, fibo etc by looking at left side of the chart:

Let's go ahead and choose the fibo retracement lines:
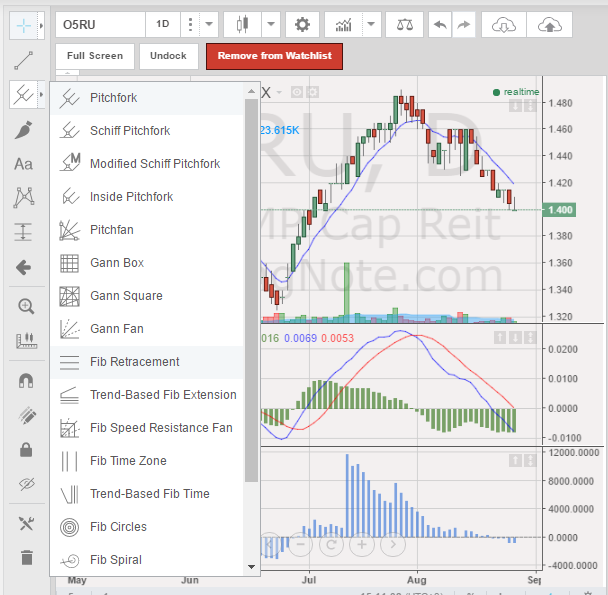
It's the second symbol, click on that small arrow and you'll see a whole host of options available. Let's go ahead and choose Fib retracement and draw it out. You'll see the results below:
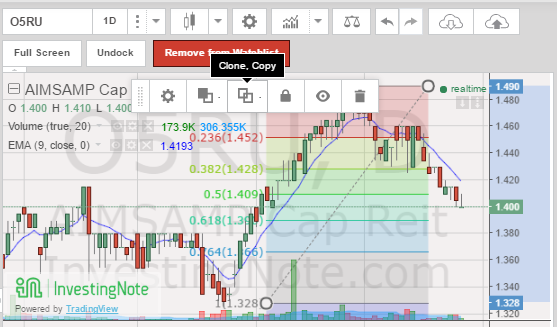
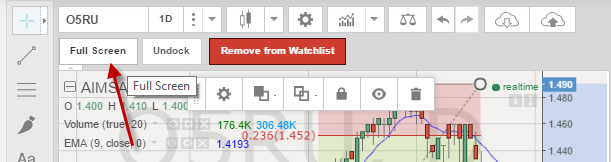
If it's too small and too much things happening on your chart, you can click full screen and blow up the chart to see it clearer:
Okay, here's the important trick. How do you save the nice charts and drawings you've done? There are two ways:
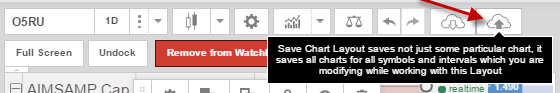
1. Saving individual charts:
Click on the Save chart layout symbol and save everything you're working on for that particular chart. They will ask you to give a chart layout name.
Once you've entered the chart name, you can retrieve it back anytime by pressing the Load chart layout
You can save your work this way.
2. Saving template:
I prefer saving template, so that I can apply this particular set of template (with this set of indicators and format) to different charts. So here's how to do it:
Click on the study template:
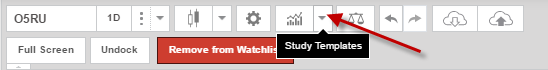
You will see the option to "Save study template as". Click on it, give the template a name and you will be able to put this set of layout onto any charts you want easily.
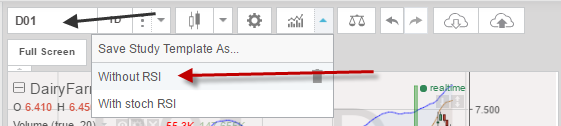
I saved two template (as shown above by the red arrow), the first is "without RSI" and the second is "with stoch RSI". If I clicked on the template "Without RSI" and click on the box (marked by the black arrow) and type the name of the counter (e.g. SHENG SIONG), I will apply this template onto the chart of Sheng siong.

Of course there are many more functions that I didn't illustrate but I think this is a good starting point to explore the platform yourself.


8 comments :
Thanks for this post. Looks good, I will be using their platform :)
Hi UN,
You use charts too? haha! Welcome to the blogosphere :)
Yup. In the midst of trying to learn TA to identify entry points :)
Hi LP,
Looks good. need to sign up and pay?
Hi Rolf,
Ya, need to register, but otherwise the platform is free to use. You can sign up and try, and see for yourself if it's good for you :)
hardworking lah u :)
posted here
to rolf suey:
psst
this looks interesting to me - link.
with your industry experience, what can you tell us about the results of this method?
I would direct you to this but I am sure you have already seen it.
Hi SMK,
Haha, I believe in paying it forward :) When I was a newbie, there are people in forums helping me out and so I'm doing what I can to pay it forward. The platform is also good to me, in fact so good that I totally stopped using chartnexus. So I should pay it forward by helping them find more people to join in. This isn't a sponsored post, it's just a good lobang that I think everyone who uses charts should appreciate :)
Post a Comment