As we go on climbing up despite the psychological resistance at 3400, bare in mind this: there is a gap at 3345 that needs to be filled, unless this is yet another breakaway gap. All indicators point more upside to come, though I think a pull back at this point to cover the gap will be healthier for future growth. Candlestick chart showers a top tweezer pattern, a formation associated with market high. Might see a pull back soon, possibly mid-week to later part of week. Major support at 3300 level. I don't think we'll need to use that support anytime soon.

Swiber seems to be neglected by the general market rally. It's funny that I'm actually happier if all the world on tension. My stocks somehow flew during those tension filled times than when we rallied. Somehow my stocks were left behind.
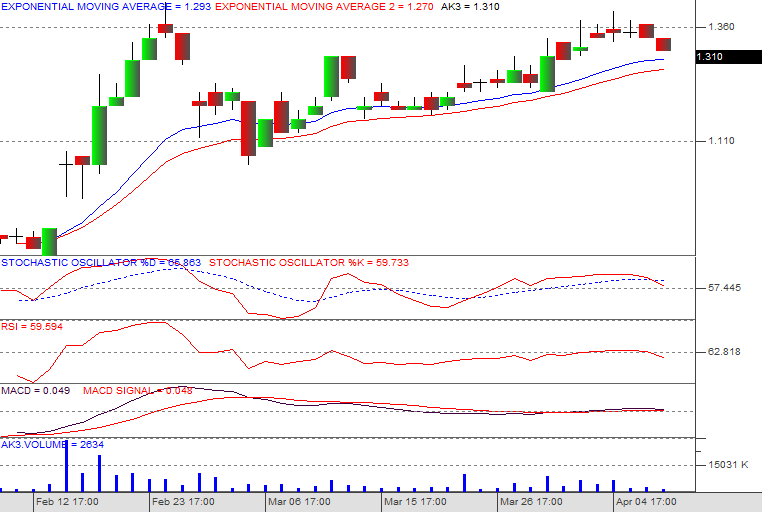
Swiber is near my cut-loss point soon. Today is contra pay day for my batch of 5 lots bought at 1.34. Today it dropped to 1.31 on low volume.
Support level: 1.30, 1.24
Cut-loss level: 1.30
If it touches 1.30 and bounce right back, I'll keep it. If not, I'll run and live to fight another day. Anyway, even if I sell it at 1.30, I'd already make some pocket money already, so no pressure.
One more chart for education purpose, to those not familiar with technicals. This is the chart of OSIM O23.

I put in bollinger band indicator, these are the 2 boundaries that surround the stock price. As you can see, the bollinger band is tigtening around the price, almost squeezing the stock price within the upper and lower boundary. This is what I call a bollinger squeeze. It happens when consolidation takes place with low volume and low volatility. Looking at the time period, Osim has been consolidating for 2 months already.
Once a bollinger squeeze is in effect, 2 outcome can happen. A very violent upswing or a very violent downswing. It's hard to tell which direction osim will go. My gut feel is actually up because of RSI steady uptrend.
The longer the squeeze is, the more % movement the price will be, once it breaks out of the bollinger band. The question is when will it break out? Nobody knows.
Europe a sea of green. Dow at +0.73.


0 comments :
Post a Comment