Bullish divergence happens when the price reached a lower low but the indicator reached a higher low. It's easier to explain this with a diagram.
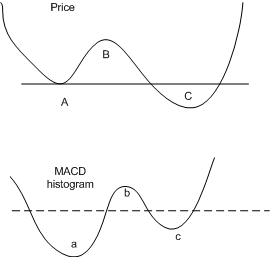
Points A, B, C are the price points of the counter. a, b and c are the indicator points. As mentioned, it can be any indicator but I'm using MACD histogram.
A and a - The price reaches a first deep low and the MACD histogram follows suit and reaches a first deep low.
B and b - The price went up and the indicator moves up accordingly too. It's important at his point that the MACD histogram point b moves above the 0 level, indicated by the dotted line.
C and c - The price reaches a lower low than A, thus establishing a lower low in price, but the MACD histogram at c did not reach a lower low than a, thus establishing a higher low.
Bullish divergence happens when price reaches a lower low (C lower than A) but MACD histogram reaches a higher low (c is higher than a). Thus a divergence between price and MACD histogram happens and the price is set to move up higher. The psychology behind this is that the indicator tells us how strong the movement is. When the price A moves down then MACD histogram a moves down accordingly, forming a benchmark for us to compare. If price C moves down even more than A, we will expect the MACD histogram to show us that the movement downwards is a stronger one than at a. Since we didn't see that happening, the second selldown in price C is lacking in strength, indicating that the price will move upwards, forming a bullish divergence.
Real examples:
UOB (weekly)
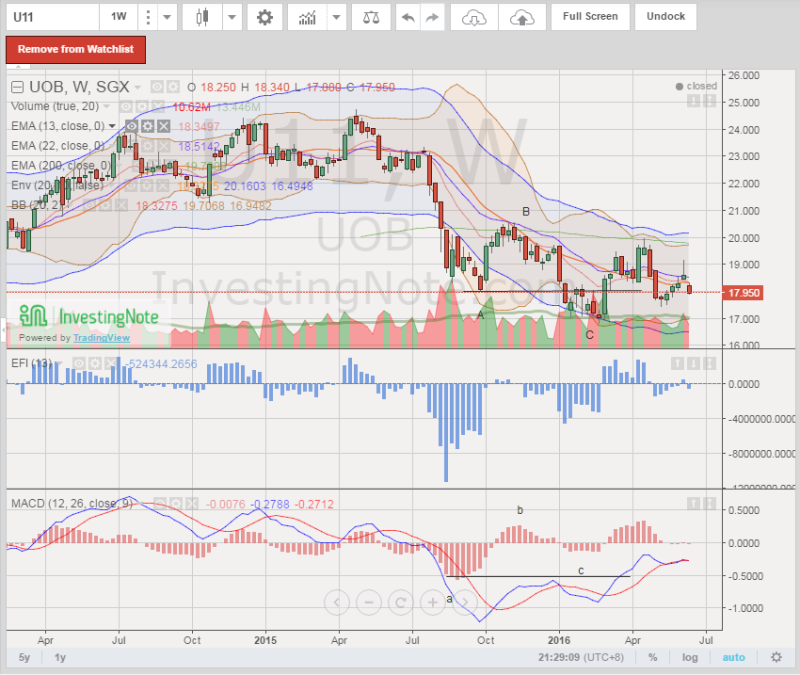
Price A moves down to a first low of about 17.95. Then it moves up to B at about 20 before coming down to a lower low C at about 17. While the price at the second low C is lower than the first low A, the MACD histogram shows us a different picture. Point c is higher than a, so we know that the second selldown at point C is a fake selldown. Price resumes upwards to about $20.
Ho Bee Land (weekly)
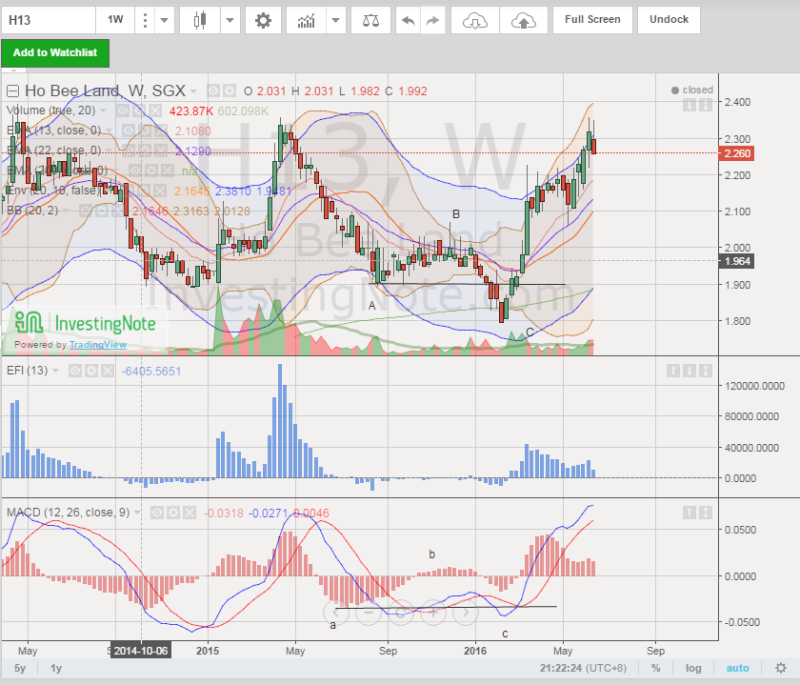
Again, you see the that the price C moves lower than A, but the indicator c did not move down lower than a, forming a bullish divergence. The price went up from the low of C at 1.80 to a higher of 2.35+ recently.
Can we go reverse and have a bearish divergence?
Bearish divergence happens when the price reached a higher high but the indicator reached a lower high. Again, let's see the diagram below to illustrate the scenario:
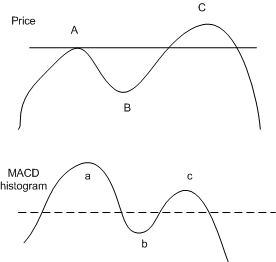
A and a - The price reaches a first high and the MACD histogram follows suit and reaches a first high.
B and b - The price went down and the indicator moves downwards accordingly. Make sure the the part b is below the 0 line of the MACD histogram mark.
C and c - The price C reaches a higher high compared to A, thus establishing a higher high in price, but the MACD histogram did not reach a higher high than c, thus establishing a higher low.
Thus a bearish divergence forms and the price goes down lower. The reasoning behind this is that the price movement upwards at point C is not accompanied by a stronger push by the indicator c, hence the upwards movement is 'fake' and a downward pressure in price ensues.
Real examples:
UOB (daily)

Price moves up to a first high at A at about 19.5, then moves down towards B at about 18.4 before going upwards again to a new high at C at about 20. While the price at C reaches a higher high than A, the MACD histogram shows us a different story. Point c is at a lower high than a, thus showing us that the 2nd upward movement at C is not real. A bearish divergence happens and the price goes down to about 17.6.
UOL (monthly)
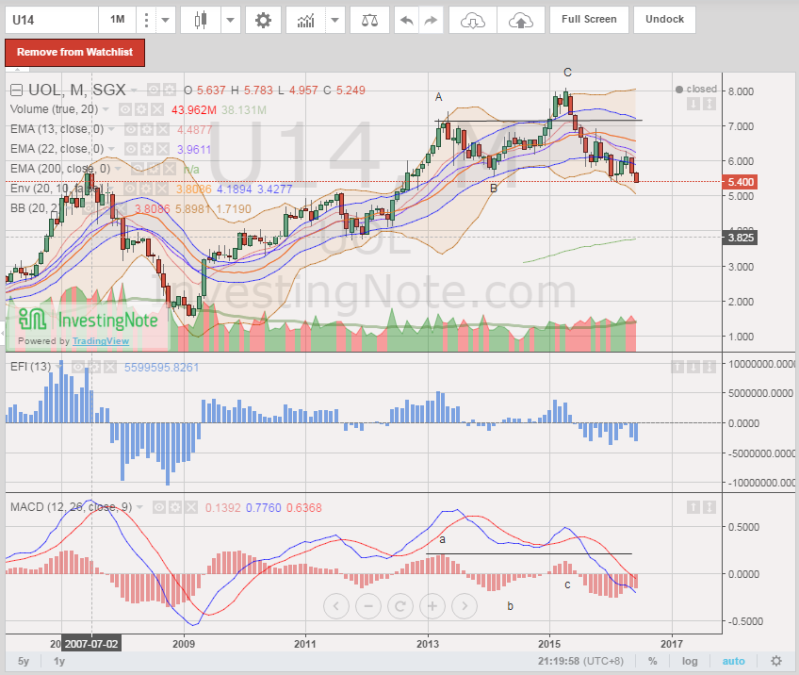
This is a very important example. There are three common time frames that we can use to check for bearish/bullish divergence. They are daily, weekly or monthly. A divergence happening in a monthly timeframe is more powerful than one that occurs in weekly and in daily. A monthly chart shows one bar of candlestick every month, so there are 12 candlesticks in a year. A divergence occurring at monthly timeframe would be a multi year movement, resulting in huge movement.
UOL had a higher price point C near 8 but not accompanied by a higher high c of the MACD histogram. A bearish divergence happens and the price slides from 8 to the current 5.40, dropping nearly 30% from it's high. We could still be in the 'slide' of this bearish divergence right now.
DBS (daily)
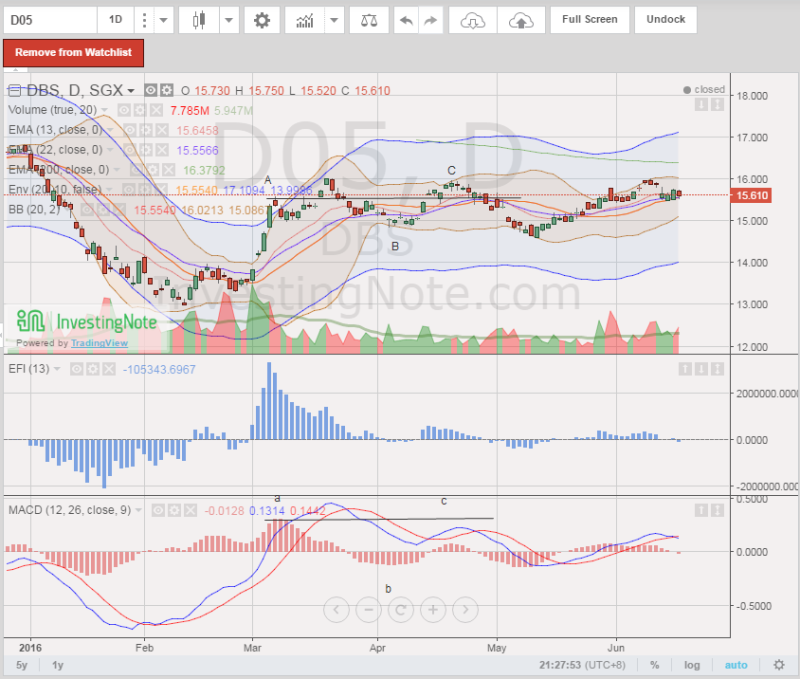
Lest anyone thinks it's easier to do divergence, let's present a complex case of a bearish divergence. Here we see three peaks starting from A and ending with C. The second peak is accompanied by falling MACD histogram, which is itself a divergence (though not by my definition). Point C reaches a higher high but not accompanied by a higher point c. This is a complex bearish divergence because it's not the standard A-B-C-a-b-c model, and this is certainly not the most complicated ones. There are others that look like a divergence but it's a fake. Divergence trap, so to speak.
Like investing, it's a science as well as an art, so we do need certain experience (i.e. make mistakes and lose money) to spot and know which is which. I did not come up with this method. Dr Alexander Elder did, so if you want to find out more, go read his wonderful books.


6 comments :
Good site.
LP,
Nostalgia.
I think most new readers may not recognise you were the Warrant Prince!
Whenever you feel like it, must remind readers of your Hidden Panda and Crouching Rabbit pattern recognition chartings!
They were hilarious!
Hi SMOL,
Hahah! You see remember my pattern :) There are some pple who asked me like it's real lol
LOL
what make you decide to write on TA again?
Hi SMK,
I think a lot of people had been asking me to do some post on TA. So I thought if I put up this post, next time it's easier for me to reference this and show them, haha!
Post a Comment