I'm at best a novice user of excel. The formula part of the excel is not a problem for me. It's the more intricate data crunching part that eludes me. So if you're already an excel expert, don't laugh at my feeble attempt.
I happened upon this question where they set up a 2 variable data table to see how it varies the final output. Fancy stuff, didn't even know I could do that! So here's me sharing how to do 2-variable data table, step by step.
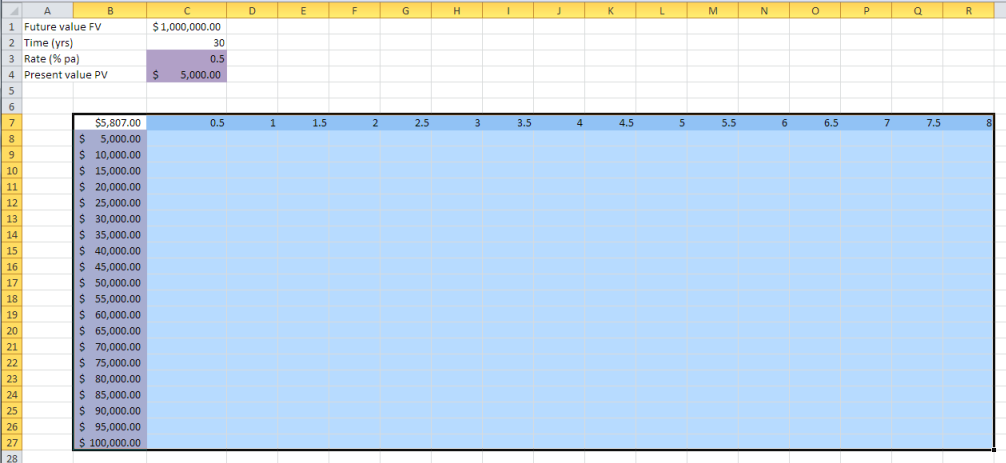
So here's my problem: I want to get a sum of money in 30 yrs time. I want to find out how much I can get by using this formula:
Future value (FV) = Present value (PV) x (1 + Rate/100)^time
There are two input variables in here, namely PV and R, and one input constant, which is time. My output data will be FV. Time is fixed at 30 yrs, and the two input variables are rate (of investment returns, at %/pa) and PV (which is the amount that I'm going to invest right now). I want to see how the two variables will affect the output, which is the future value FV, given this particular set of constraints.
I limit my PV to go between $5k and $100k inclusive, and my rate between 0.5% and 8% inclusive.
Step 1: Key in the data in excel.

The cell B7 is using the formula: = C4*POWER((1+C3/100),C2). It doesn't matter what rate or PV you used initially. I used 0.5 and $5000 at first, but it doesn't really matter.
Step 2: Key in the rows and columns.
The rows I let it be the rate, ranging from 0.5 to 8 with incremental steps of 0.5%. The columns I let it be the PV starting from 5k to 100k, with incremental steps of 5k. Do note that the rows and columns must be to the right and bottom of the cell B7.

Step 3: Highlight cell B7:R27, as shown below
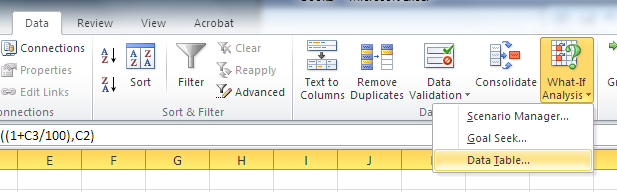
Step 4: Go to Data / What-if-analysis / Data Table and click on it.
Select row input cell as C3 and column input cell as C4. Basically you're telling them that you want the row of cells (C7:R7) to the right of B7 as the Rate (C3) and the columns of cells below B7 (B8:B27) as the PV (C4).
Step 5: Done!
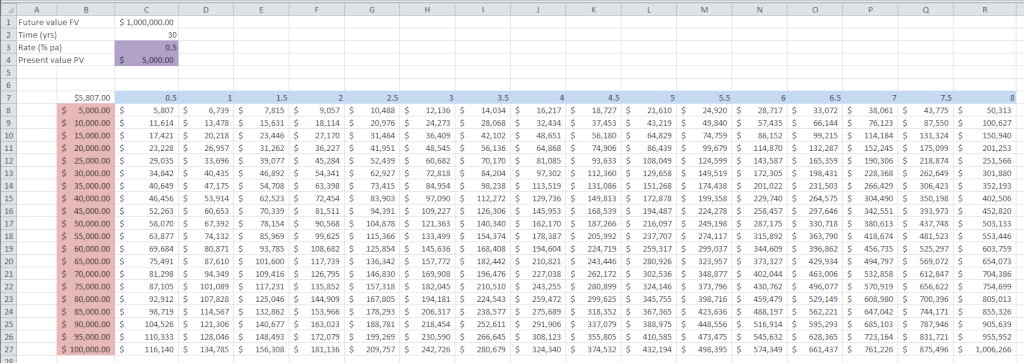
You can now analyse the data based on the different inputs of rate and PV. For example, if you want to reach 200k at the end of 30 yrs, you can do a few options:
1. Put in 20k and invest at 8%
2. Put in 35k and invest at 6%
3. Put in 80k and invest at 3% and many other options
This is seriously going to be helpful for me!


6 comments :
Do you know there's PV function in Excel too? hahahaha
Hi Pero,
Yup, that I do :)
Hi LP
Thanks for the tutorial :)
As discused the other time, you may want to use a software installed in excel called the risk solver platform (which you can get free trial at http://www.solver.com/risk-solver-platform to try out).
This allows you to perform analysis such as Monte Carlo or decision analysis where it gets a step better by having excel gives a summary report that shows the optimal of the two (or more) variables combined together. Imagine if you were to play with more than 2 variable inputs, excel 2-d format wouldn't have done the trick.
Give it a try, I'm sure you would love it. :D
Hi B,
I suspect I'll have to do that soon :) I'm in the first few chapter of the book, so towards the back there'll be lots of optimisation models and simulation. Might have to use that excel add on you've mentioned ;) I think this course is one of the most fun ones I've taught lol
hi LP, I have been an avid follower of your website for quite a few years. I am very impressed with your generosity of your free knowledge sharing to your readers. keep up the good work!
on a side note, lets exchange blog links!
Hi Jeff,
Added! ;)
Post a Comment