Just out of curiosity, I did a study on the ROE vs PB ratio for the different banks across the region. I fully understand that it's not a good apples to apples comparison because different banks have different regulations and capital requirements, and also different rules to recognise profits, bad debts and so on. But it's still good to see how the banks fare on these two metrics across the board.
All the figures are taken from the bestest platform to happen onto me this year: Investingnote. I don't just use them for the charts, but if you click on the tab 'Fundamentals', you can also get a quick and dirty ratios that are used commonly. They just don't have ROE, so I have to use a quicker and dirtier way to get my ROE by taking two ratios that they do have in the platform, namely Price to Book and Rolling PE. I just took the Rolling PE divided by the Price to book to get a rough ROE. For those companies that I can't find it from Investingnote, I used Yahoo finance to get the figures I want.
Don't trust me, I could have keyed in wrongly though.
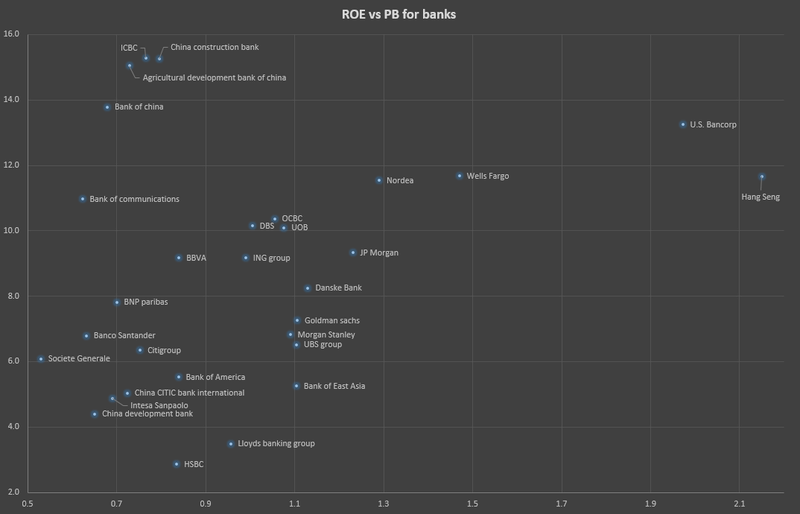
Anyway, here's the scatter plot:
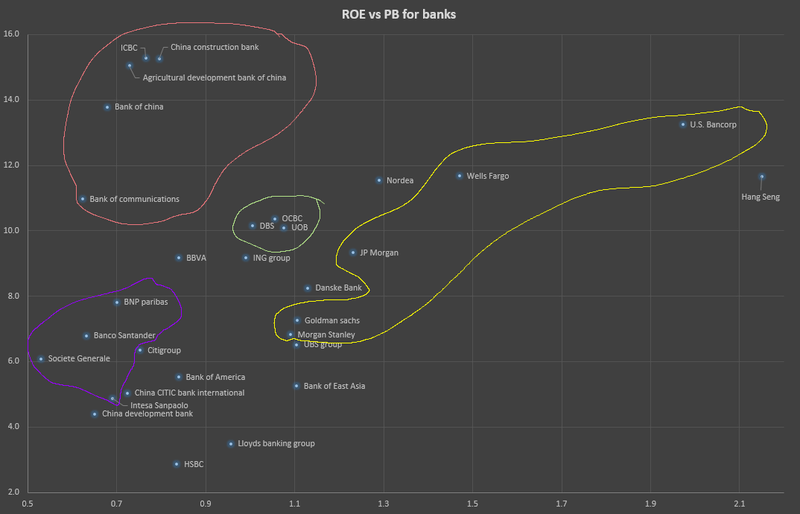
First look is that you can see a few clusters. Let me roughly group them for you:
The pink ones are the HK/China banks listed in HK. They are supposedly the best since they have the highest ROE with the lowest PB. But can their book value be trusted? We need to dig deeper into the figures. The best among them is ICBC and Agricultural development bank of China. ROE of 15+% with a PB of 0.7 to 0.8 is fantastic. Too good to be true? Again, I recommend readers to dig further and not to take these figures at face value.
The green cluster is our Singaporean local banks: OCBC, DBS and UOB. All of them have very similar ROE with OCBC taking the lead. DBS is the only one that is still priced below book (PB < 1) so technically they are still undervalued in terms of that.
The yellow cluster spread over a whole range of PB ratio, and these are the US financial firms. Of these, Wells Fargo and JP Morgan seems to be the best. US Bancorp seems too overvalued, even though they have the highest ROE.
The purple clusters are the banks from the EU side. Generally they are not doing too well, since they occupied the lower left corner of the scatter plot, characterised by low ROE and also low PB. It's interesting when there are investors who only look at PB ratio and determine that a low PB is always a good thing. Take a good look at the troubled banks. Almost all of them have low PB.
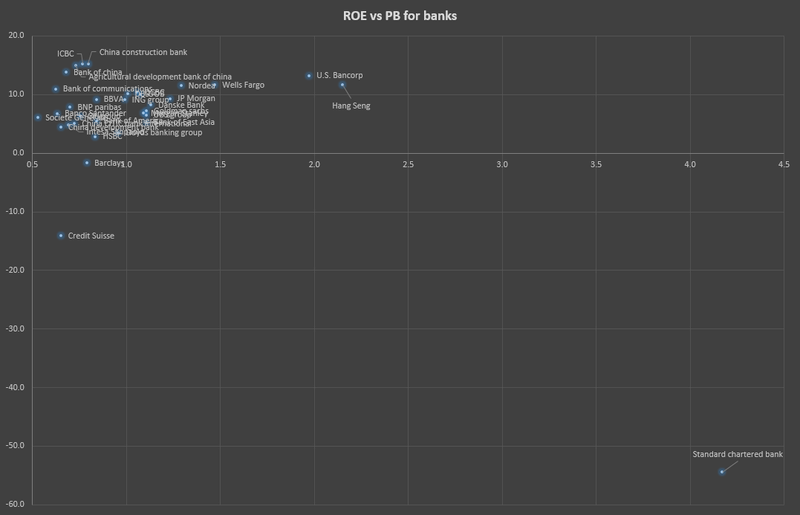
Why almost? You might also be wondering where is standard chartered bank? Here it is:
I excluded those banks with negative ROE (meaning they have negative earnings) so that we can see the scatter plot clearly. Barclays, Credit Suisse and Stanchart is right below the x-axis because they have negative earnings. The high PB ratio of Stanchart is strange. I didn't dig further but accepted the figures as it is. But those who are interested might want to do the dirty work of perusing their statements.
Seriously, I still think our local banks are worth buying, even after this recent run up. At the peak, they can reach a PB of 1.9 to 2.0. We're now around PB of 1.0 for the 3 local banks, so you can do your own calculations. Even at 1.5, there's still a lot of room.
STI 4000? Hahaha!
