Showing posts with label Fundamental analysis. Show all posts

Thursday, May 25, 2017

Is Haw Par a golden tiger or a sick cat?

This is a guest post by the kind folks over at Investingnote. It seems that now they have an in house technical chartist and an analyst as well. Good for them. It's quite a detailed analysis with FA and TA perspective, but this kind of company isn't my cup of tea, LOL. The chart failed to trigger any buys in my system, so yeah, it's good to know about the company and keep it in mind the next time you use their signature muscle rubs or ointment.

-----------------------------------------------------

A Golden Tiger: $Haw Par(H02 )


This column is jointly written by @fayewang, @calvinwee, @gordon_ong and @devinnath

 -Faye is both a fundamental analyst and economist by nature. She is a global thinker who’s open-minded and enjoys learning from the market.
 -Calvin is a fundamental analyst at heart and an ardent disciple of value investing. He relishes the process of searching for undervalued stocks and enjoys collecting dividends from his stocks.
 -Gordon has a demonstrable interest in equity investments, financial markets, and negotiating deals. As @NTUInvestmentClub president, he has an understanding of what factors drive an organisation’s success. -Devin is a technical analyst who balances FA and TA in his investment decisions. He believes in using news and FA to spot the right stocks and rely on TA to give him the lowest risk-to-reward ratio possible.

Brief Background: Haw Par Corporation Limited is engaged in manufacturing, marketing and trading healthcare products; providing leisure-related goods and services, and investing in properties and securities. The principal activities of the Company are licensing of the Tiger trademarks and owning investments for long-term holding purposes, the history of the brothers Haw and Par traced back to the 19th century. The company distributes its products in the Americas, Africa, the Middle East, Asia, Australasia, and Europe.

Product Segments: Haw Par operates in four segments, namely
1) Healthcare - principally manufactures and distributes topical analgesic products such as Tiger Balm and Kwan Loong.
2) Leisure - provides family and tourist oriented leisure alternatives through its owned and operated oceanarium, including Underwater World Pattaya in Thailand.
3) Property - owns and leases out various investment properties in the Asia region.
4) Investment - invests primarily in quoted and unquoted securities in Asia region.

Performance Summary: Haw Par recorded a dip in profit from operations and investments of 2% mainly attributable to lower dividend income from investments. However, it should be noted that all operating segments generated higher profits in FY16. The healthcare business segment continued to contribute significantly to the Group’s revenue with a 16% increase in revenue from $152.6 million to $176.4 million. Correspondingly, healthcare’s profit increased 37% from $48.1 million to $66.1 million with higher sales and reduced operating expenditure. However, revenue from the leisure business segment registered a sharp drop of 34% to $8.4 million due to the closure of Underwater World Singapore (“UWS”) in June 2016. Therefore, leisure recorded profit of $0.9 million in FY16 compared to loss of $4.3 million in FY15 due to the one-off impairment charge in fixed assets of UWS in 2015.

Financial Highlights:


 1. Operating performance Haw Par Corporation’s revenue has increased steadily since 2012, and this is also reflected in its profit before taxes. However, PBT decreased slightly by 1.6% yoy due to the lower dividend income received from investments. In that light, it should be noted that all of its operating segments generated higher profits yoy, however the profit contribution from Investments dropped by 31%, leading to an overall decline in PBT.

2. Financial & cash position Haw Par’s Operation Cash flow recorded yoy increase since 2012, and FY16 was no different since it reported higher profits across all its operating segments. However, there was a sharp drop in its total cash flow by 30% yoy. This is attributed by the decrease in financing cashflows by $24.8Million. Correspondingly, it recorded a fall in the lower cash and cash equivalent in the balance sheet by 0.51% yoy.

3. Segment performance Traditionally, Haw Par Corporation derives its revenue from the investments income segment. The overall group revenue for FY16 at $201.6 million grew 13% yoy, with Healthcare and Property recording 16% and 25% increase in revenue respectively. Operating segment profits before interest expense and tax for Healthcare and Property grew 37% and 22% respectively. However, investments income decreased 31% due to lower dividend income from investments.

4. Stock information Haw Par Corporation has a very low D/E ratio of 2%, hence it can raise additional financing if they wish to acquire more assets in any of their business segments. On the other hand, Haw Par does not have a remarkable ROE and ROA, hovering between 4-7% from 2012-2016. This is likely because most of its business segments are in the mature stage and have limited growth potential. However, it should be once again noted that it derives most of its revenue/profits from its interest in UOB, UIC and UOL group, hence its overall profits is highly dependent on the performance of these 3 companies. Haw Par has a dividend yield 1.9% for FY16. We were unable to find a comparable company for Haw Par Corporation in the SGX stock universe, hence, we decided to skip the peer analysis for Haw Par Corporation.

SWOT Analysis


Strengths:

1. Renown of brand. Brand of Haw Par retains a history over 100 years that can be traced back to 1920s. With famous Tiger Balm as its representative product, Haw Par held competitive advantages of competition in the healthcare industry considering exceptional brand awareness. Despite the long history, Tiger Balm became iconic for the sake of its incorporation in Singapore traditional culture. Brand loyalty is another benefit from well brand management. It is brand loyalty that become a significant obstacle for new entrants, as they may fail in the competition due to strong brand loyalty of customers to existing players.

 2. Uniqueness of products. Haw par differentiates its Tiger Balm from other healthcare products with secret herbal formulation. Therefore, the effect of substitution seems limited to Tiger Balm. For sure there are other pharmaceutical manufacturers who provide analgesic products, for instance, liniments or oils made by using Chinese medicine. Nevertheless, they can merely bring competition but cannot replace Tiger Balm. In Singapore market, the uniqueness of Haw par is more apparent, it is difficult to find a listed company that operate similar business as Haw par does.

 3. Organic Growth of Core Business. Though Haw par is involved in various industry such as property, leisure, and investment, its core competency is derived from healthcare segment. Growing proportion of profit from investment segment has been observed in recent years, which makes Haw par looks like an investment holding firm. However, it is worth noting that revenue generated from its healthcare products enjoy continuous growth with an average rate of 40% over 5 years.

Weaknesses:

1. Haw Par’s leisure segment. Main business of Haw par’s leisure segment is its Underwater World Pattaya (UWP) in Thailand and Underwater World Singapore (UWS) in Singapore. Profit contributed from Leisure segment has experienced continuous decline since 2012. The segment suffered from loss in financial year of 2015, which is related to the terrorist attack at Bangkok in August 2015 and flash flood in Pattaya. Leisure’s profit swung to black in 2016, while Haw par decided to close UWS afterwards. The close was claimed due to the expiry of lease contract on Sentosa island, albeit more likely to be for profit improvement purpose.

2. Investment portfolio. In Haw par’s balance sheet, financial assets occupied 81.9% of its total net assets. In other words, majority of its net assets is made of securities of UOB, UOL, and UIC, which worth $2 billion in 2016. Therefore, Haw par’s profitability is closely tied to the performance of UOB, UOL and UIC. The investment portfolio cannot be considered as absolute ‘weakness ‘of Haw Par, but it exposes Haw par with greater volatility to the performance.


Opportunities:

1. Further expansion. To fully utilize the renown of Haw par’s brand, Haw par can make more efforts to expand their business for greater presence in the global market. At the current stage, income generated from local market merely occupies 18.6% of the total number, meanwhile 35% of the revenue contributed by other Asian countries outside the ASEAN area. Based on the data, we can conclude that Haw par has exploited and penetrated the Asia market, but seems has not started its exploration in other potential countries. With sufficient cash in hand and light debt burden, Haw par is at an appropriate position for global expansion. The expanding strategy can be introducing new products in various markets through franchise.

2. Segment restructuring. Haw par has closed the Underwater World Singapore (UWS) in Sentosa island, thus the segment of leisure greatly shrunk in 2016. As mentioned in the weakness part, the leisure segment suffered from plummeted revenue and the loss even eroded profit from other business. It might be wiser if Haw par gradually shift their investing emphasis to healthcare and investment business only.

3. Long-term flourish healthcare industry. The growing number of aging population and better awareness of healthcare jointly lead to stronger demand for healthcare services in the future. Advanced technology allows Haw par to extend its products line and seek for more opportunities in this resilient industry. Threats: 1. Increasing competitors. Rapid growth in healthcare industry has attracted more companies to enter and share the market pie. Increasing number of competitors is the biggest threat Haw Par is facing now. Products such as Yunnan Baiyao from China and Mopidick’s from Japan have brought intense competition to Tiger Balm.

Key Drivers & Limitations 
Expanding to new markets and modernizing the Tiger Balm brand


Haw Par’s strategy of widening Tiger Balm’s product offerings to include Medicated Plasters, Mosquito Repellents, Cooling Patches and Lotions, as well as modernising the packaging and marketing strategies, seems to have revitalised its attractiveness to consumers. Haw Par has also successfully capitalised on the recent ASEAN mosquito virus outbreaks to increase sales. With such outbreaks being frequent within the region, Haw Par has a consistent sales driver.

Haw Par has also capitalised on Tiger Balm’s brand strength to attract distributors and remain asset-light – recently, it has partnered with Alkem to expand its distribution network in India. Haw Par’s distribution network remains formidable throughout the world. Such a business model means that Haw Par can sustain its high margins in the foreseeable future.

Acquisition for growth in Healthcare/Leisure segments 
Haw Par is currently seeking acquisition targets to utilise its net cash position. It has stated that it may do horizontal integration of other healthcare products to add to its Tiger Balm brand. Such an acquisition will support the overall business-level strategy of dominating the topical analgesic market through consolidation under a single brand. Haw Par also seeks to acquire leisure destinations to utilise its decades-old expertise of running tourist attractions. Depending on the acquisition target, this will most likely increase Haw Par’s low ROE and unlock shareholder value. Haw Par seeks to maintain its low profit margins; hence it will most likely acquire products rather than expand overseas using physical stores.

Exposure to Banking and Real Estate Sectors
Haw Par not only has equity investments within banking and real estate, but also has its own property division. Hence, its asset value and investment income stream are exposed to the high earnings expectations on SG banks, as well as occupancy rates/rental yields from its SG and MY properties.

Analysts’ Opinion 
Key takeaways by @calvinwee

Haw Par is a household brand synonymous with its flagship product: Tiger Balm. However, with deeper analysis, one will realize that over the years, Haw Par Corporation has diversified into different business segments such as leisure and property. Also, management has shown great prudence in maintaining a strong balance sheet and free cash flows. Most importantly, it derives a substantial portion of its profits from UOB, a big 3 bank in Singapore. I am of the view that its healthcare segment has the potential to grow, albeit at a slower rate, with its expansion into European and US markets. Barring no major changes in the 3 companies that it is vested in, Haw Par Corporation is a safe haven amidst the volatility in the market.

Comments below is written by @Gordon_ong:

Haw Par is a Portfolio of UOB, UOL and UIC at deeply discounted values 
To find out what is Haw Par’s current equity stake in UOB, UOL and UIC, we first assume that there are no changes in shareholdings since FY16 annual report. To test this assumption, we will see what is the fair value change on these financial assets (FVOCI) for 1Q. If there are no changes in shareholdings since the last annual report, the fair value change should be 182m.


 The actual fair value change as stated in 1Q report is 189m, almost the same as assumed. Hence, we can conclude that there are no significant changes in Haw Par’s investment holdings.


Hence, based on the share price of $10.43 and market cap of $2.290B, the Total Enterprise Value is $2.015B. This TEV includes a liquid portfolio of 3 shares with combined market value of $2.2B, Investment Properties of $200M valuation, and a business worth about $1B. Based on a sum-of-parts valuation, TEV should equal to $3.4B and market price should be ≈$15. It can be argued that the market has grossly undervalued the price of Haw Par. In fact, purchasing Haw Par shares means acquiring an investment portfolio for cheap, as well as a stake in the investment properties and the underlying Haw Par business for free. 

Usually, stocks that trade at a discount to NAV have negative operating profits. However, in Haw Par’s case, not only is the Tiger Balm healthcare business still profitable and growing, the net assets are not hard-to-dispose-of fixed assets, but equity stakes in other businesses. 

One consideration is whether Haw Par is a “value trap”, a.k.a Haw Par will hoard the dividends paid by its investments within its business without distributing to its shareholders. Even in this worst-case scenario, as Haw Par’s main businesses are profitable, defensive and secured by a deep economic moat (brand strength), Haw Par’s cash position and equity stakes will just grow indefinitely until a catalyst unlocks value for shareholders e.g. continued growth of healthcare product segment or some form of M&A. To test whether Haw Par hoards cash, we simply measure the investment income received vs. dividends paid out.


 While Haw Par does retain a portion of its investment income, its other business segments contribute such that the total dividends paid is higher than an equivalent weighted portfolio consisting of UOB, UOL and UIC. Notably, healthcare segment’s growth in new markets support Haw Par’s ability to pay out higher dividends recently. 

The Dividend Payout Ratio and Historical Dividend Yield also show that dividends from Haw Par is near equivalent to investing in a weighted portfolio of the 3 stocks. Even though the dividend yield of Haw Par is slightly lower, the excess cash is going into Haw Par’s cash reserves. Hence, the 48 b.p. is not lost, but merely locked up within Haw Par’s cash reserves, which shareholders still own a stake of. 

Overall, Haw Par does indeed distribute its investment income from its equity portfolio to its shareholders. A shareholder of Haw Par will gain more dividend benefits compared to directly holding an equivalent portfolio of the three shares. As the risk of Haw Par suddenly hoarding investment income is negligible given its track record, there should not exist such a discount on valuation for Haw Par’s equity portfolio. 

Unless you believe that UOB, UOL and UIC are grossly overvalued by the market, as long as Haw Par’s TEV remains lower than the market value of its equity portfolio, it makes complete sense to buy more of Haw Par. While acknowledging that Haw Par has been consistently undervalued for the past 10 years vis-à-vis its equity holdings, the gap between Haw Par’s value and its equity holdings has narrowed, signaling that the market has taken notice. 

Investors should view Haw Par primarily as an Investment Holding company at discount prices, with its success as a healthcare product company as a pure bonus.

For investors interested in $UOB(U11), can consider purchasing shares through $Haw Par(H02) for greater value. A portfolio of banks, real estate and healthcare seem to fair well against interest rate risk. Vested in Haw Par; DYODD. Downsides: During expansion, management may decide to modify Haw Par’s healthcare segment from an asset-light distribution model to an asset-heavy model, requiring cash. However, unlikely based on conservative management’s previous reinvestment rate. Also, SG Banking and Real Estate sectors may weaken affecting value of equity holdings – yet holding an isolated UOB/UOL/UIC stock will be even worse in that scenario. 

Technical Analysis 
 From TA (Technical Analysis) perspective, followings are the analysis of Haw Par as of 23rd May 2017. This part is written by @devinnath.


-Taking highest high and lowest low from 12 month time frame (July 2016), it appears that Haw Par stock price has been testing the resistance line at $10.500 since the beginning of May 2017. 
-Channel width is considerably wide, contributed by the bullish steam at the start of 2017 (Jan-Feb). Although an untested weak support range is formed between $9.745 and $9.837, strong support remains low at $9.360 
-Stochastic Oscillator (14,3,3) and MACD (12,26,close,9) both agree that there is no apparent highlight of trend being formed in the past month, although both indicators signalling a slight uptrend (MACD : 0.1117) and minimal buying pressure in the market (slow %K = %D : 65). 
-Parabolic SAR on the other hand acknowledges the position of the price on upper boundary of Bollinger Band (20,2) by showing a possible price stop and reversal, hence the stock price might be taking a bearish stance in the near future. 

I believe that it is rather reasonable for investors to expect a significant attempt to break the strong resistance line at 10.500. This attempt will be indicated by a sharp hike in price above $10.500, which the result will determine the future trend direction of Haw Par stock. 

Best case scenario: If price manages to break the resistance line and stays there for at least 2 days, then high chance it will continue to take its bullish stance. Once its position is reinforced, it will be the perfect time to enter the trade. 

Worst case scenario: If price fails to stay above the resistance for 2 days, similar event with 12th May might reoccur, e.g. price broke through the resistance but failed to maintain its stance as bearish engulfing pattern appears the following day. It will form a double top pattern which might impose a very strong selling pressure. This might be followed by breaking the weak support towards the strong support line. 

Conclusion: In order to mitigate risk, It will be in our best interest to wait and see how the market behaves around the resistance and let time reveals itself. 

This article is written by by @fayewang, @calvinwee, @gordon_ong and @devinnath from InvestingNote. 


InvestingNote is the free social network platform designed specifically for crowdsourced investment ideas, news and interaction for the holistic stock investing community. Investors can identify trends, market movements and sentiments through crowdsource analysis that can make them better at investing. With free access to a wide variety of stock data, investors can upload research reports, utilize technical charts and make stock price targets that will be visible to other investors. It promotes financial literacy and connects investors for better investing outcomes. Our users come from a wide spectrum of the investing community: remisiers, brokers, brokerage houses, financial writers, financial bloggers and the general retail investors.

Thursday, March 02, 2017

Comfort delgo : Goodbye or good buy?

This is a guest post from Investingnote. It's regarding Comfort delgro and it's mainly about touch and go FA and other industry news. I had already bought it some days ago and my views can be summarised in two pictures:

Comfortdelgro weekly: bullish weekly divergence

Comfortdelgo daily: break out of down trend line and retracing back to trendline
---------------------------------------------------------------------------------

Can ComfortDelGro(C52) regain its customers of taxi service?


Brief Background of ComfortDelGro: 

ComfortDelGro Corporation Limited is a Singapore-based investment holding and management services company. It operates in eight segments:

1) Bus & bus station
2) Rail
3) Taxi
4) car rental and leasing
5) automotive engineering services
6) inspection and testing service
7) driving centre and
8) insurance broking services and outdoor advertising.

Summary of ComfortDelGro’s recent financial performance: 

The group maintains a steady growth of net profit despite a slight revenue decline caused by unfavourable currency translation this year. With the entrance and fierce competition brought by Uber and Grab, ComfortDelGro’s taxi business succeed to keep growing profitability. The five-year lowest P/E ratio indicates it is undervalued in a greater degree by the market. However, ComfortDelGro’s actions and measures towards issue of diesel tax and further competition are vital.

Recent Event: 10 Feb 2017 ComfortDelGro - Full Yearly Results of 2016 

Key Financial & Operating Highlights:

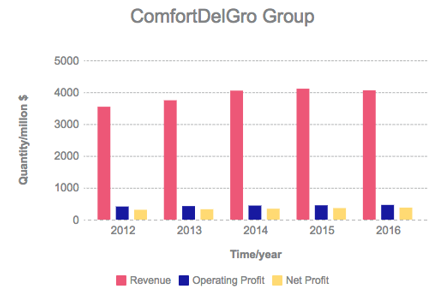
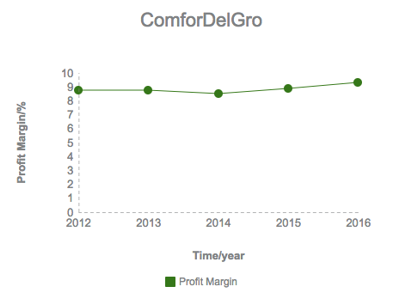
1. ComfortDelGro group had a steady growth of revenue during the period from 2012 to 2015, but experienced a light drop (1.26%) of revenue in 2016, which is mainly caused by unfavourable foreign currency translation, as the Group revenue should have been increased 1.76% by $72.4m. Stable growth of both operating and net revenue can be observed, but the growth rate has been declined after 2014. Also, the group achieved its highest profit margin in 2016.


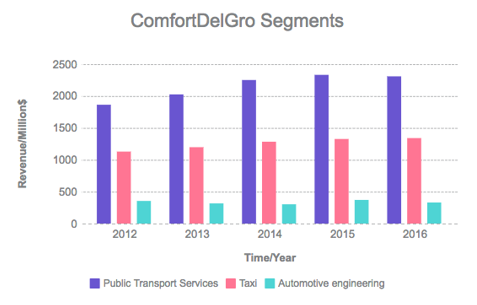
2. From the perspective of segments operation (the eight segments can be found in the previous part of Brief Background), in the financial year of 2016, more than half (57%) of the group revenue was contributed from the segment of Public Transport Services Business. One third (33%) of the group revenue was driven by the segment of Taxi business, which is also the most discussed segment in recent years because of the competition from Uber and Grab. Approximate 10% of their revenue came from the Automotive engineering services.


The chart represents revenue of the three largest segments of ComfortDelGro. According to the chart, revenue of taxi business managed to maintain slow growth under the competitive pressure of Uber and Grab, especially after the aggressive expansion of Uber in early 2015. ComfortDelGro stated in their financial report that the revenue growth in the Public Transport Services Business, Taxi business, and the Driving centre business was offset by the decrease at Automotive engineering services business, the Inspection and Testing Services Business, the Car Rental and Leasing Business and the Bus Station Business.


3. Compared to the number of 31 Dec 2015, the group burdened less secured and unsecured borrowings and less payables. Total equity had a growth of 5.96%. Net cash generated from operating activities edged up to $702.5m from $600.2m at the same period of last year. However, the amount of free cash flow has a small slide of 1%. Overall, the group maintained a stable financial and cash flow position.


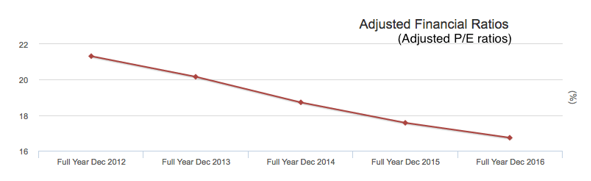
4. Now the group has a P/E ratio of 16.732, lower than that of the Transport industry (33.267), it is also the lowest number observed during the five-year period since 2012. The Earning per share (EPS) is 14.7 cents, with a dividend yield of 4.187%. (source: here)


ComfortDelGro’s Competition with Uber and Grab:

Are entrants of private-hire car threatening the profitability of taxi business?
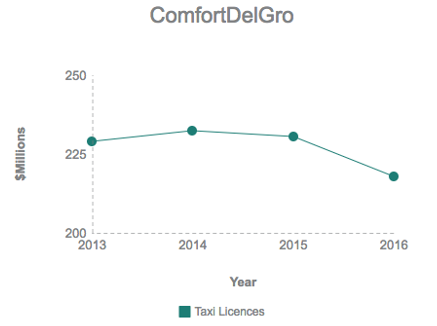
After Uber and Grab entered the market, the amount of taxi licences issued was indeed affected by the rivalry.

“There are early signs of taxi weakness”, refer to the full article here.

For ComfortDelGro, the quantity of taxi licences were prone to fall since 2014.


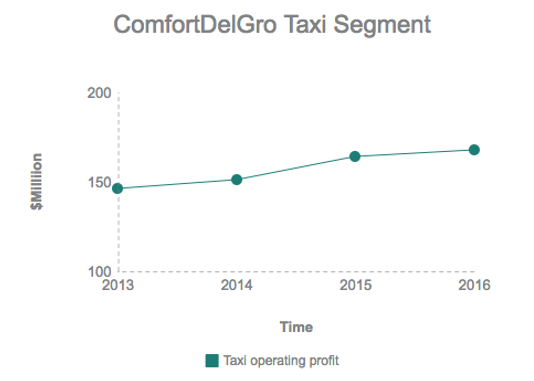
However, the group presented positive numbers in both revenue and operating profit of Taxi segment during the recent years.

Hence, during the competition with Uber and Grab in the taxi industry, ComfortDelGro neither suffer from decreasing profit nor from loss. The possible reason could be that certain amount of consumers choose Uber/Grab because of the attractive coupons/Promo code they can use for car services. However, under the circumstance of urgency, they still prefer taxis as they do not have the time to schedule rides in advance and do not wish to waste time waiting for the Uber drivers. ComfortDelGro has witnessed improvement in service quality since they started the competition with Uber and Grab.


Is the Business of Uber and Grab sustainable?


Uber and Grab have proved their success by conquering the Singapore market and becoming well aware by people within a short period of time, but still, they face various obstacles with their operations.

1. How long can they allure customers by using promo code?

2. Private hire cars obey the Road Traffic Act (RTA) that they cannot carry a passenger who is under 1.35m without a booster seat or a child restraint. Taxi do not required to follow this Act because they are public vehicles. Related news here.

3. Singapore's private car hire business including Uber and Gran need to be licensed according to the amendments to the Road Traffic Act (RTA) after 7 February. Related news here.

4. Private-hire scam deteriorate customer’s trust. Related news here.


New threat: increasing diesel cost and new competitor HDT singapore

The Budget 2017 of Singapore announced the levy of diesel tax of 10 cents per litre, thus increase the operating cost of taxi business. Though taxi operators adopt plans to pass on tax reduction savings to drivers by less rental fee, the actual cost will increase according to research.

“Budget 2017: SMRT, ComfortDelGro to pass on diesel tax savings to taxi drivers”, to see the full article here.

“Diesel tax will add to costs, say cabbies”, refer to the full article here.

The new competitor HDT taxi company expand their customer base quickly and adopt a fixed salaries with benefit plan. Refer to the full article here.


Trans-Cab and Premier Taxi adopt new plans to attract cabbies

The 2 taxi operators introduce surge pricing (dynamic fares) and cut their rental fee to deal with competitions from Uber/Grab. But ComfortDelGro, as well as SMRT taxi, has not disclosed any intention towards the new plan.

Related news: “2 taxi firms plan to Grab hold of more customers”, shared in the post of @FGD, refer to the news here.

“Trans-Cab cuts rental fees in bid to attract cabbies” here.


What's the discussion in our community? 

“Ever-increasing challenges for Uber’s profitability”, shared by @alansmith in the post of https://www.investingnote.com/posts/47910

“Cab operators urged to offer driver more job options”, shared by @bgting in the post of :https://www.investingnote.com/posts/47721

@yjlim queried the opinion that Uber/Grab threat the business of ComfortDelGro in Taxi business, to see further discussion and share you opinion in the post :https://www.investingnote.com/posts/46795

@raynersu held the opinion that ComfortDelGro group did not make enough effort in updating their strategy for the latest market trend but rather stay out-of-fashion, while their peer Taxi operators keep improving and acquiring larger share of market gradually. Refer to more discussion in the post:
https://www.investingnote.com/posts/48547


Our Key Takeaway: 

ComfortDelGro performed well under the fierce competition with private hire services and new entrants in Taxi business. Under the circumstance that Uber or Grab maintain their operating strategy, ComfortDelGro group has a great chance to gradually gain their customers in Taxi services back. However, facing with declining growth of revenue, ComfortDelGro group has to carry out appropriate measures to deal with rising diesel cost and make greater efforts on cost reduction. Additionally, ComfortDelGro’s movement towards the latest plan promoted by Trans-Cab and Premier Taxi is vital.

For ComfortDelGro, and also for the taxi industry, it is the right time to have an innovation now.

Also check out some estimations:
@Breaddbutter: https://www.investingnote.com/posts/44331
@simontan0: https://www.investingnote.com/posts/47904 
@Lunner: https://www.investingnote.com/posts/47895
@hk1: https://www.investingnote.com/posts/47859 
@thatsasecret: https://www.investingnote.com/posts/47204
@chinnamng: https://www.investingnote.com/posts/46630

Saturday, December 19, 2015

Digging deeper into ROE

Look at this company's ROE below:

FY 2011  -- ROE 72.6%
FY 2012 --  ROE 47.7%
FY 2013 --  ROE 33.7%
FY 2014 --  ROE 25.6%

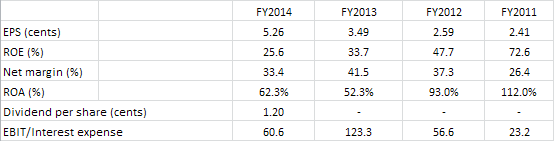
The ROE (return over equities) keeps falling from the 70+% range towards the current 25% range, but it's still pretty high. Would you say something is wrong? If so, what went wrong? It's important at this stage to break up the ROE into parts. It's called Dupont analysis, where ROE is split up into three components, net margin, asset turnover and leverage. If you multiply all the three components together, you'll get ROE, as shown below:


Here we can see that the net margin is very very good. Considering that the company IPO in FY2013 (hence anything before is suspect to me), I'll just concentrate on the 2013 and 2014 era. Net profit of 30+% is incredibly high. Take note that the leverage is also dropping from year to year at the same time. This means that the ROE is sustained by the higher asset turnover and also lower leverage. So what if the ROE dropped? It's still okay!


ROE is net profits over equity, so let's check the net profits over the years.


Revenue is rising, and net profit is rising also, but not as fast, which means that the cost of producing the profit also increases. But cost increasing is not such a bad thing. In their case, it's because there's a bigger cost attributed to project and production cost. They set up the cost first and ask for progressive payments, somewhat like construction industry. If there's zero cost, I'm going to have to start worrying for their revenues the next financial year!


It's like free cash flow. If it's reducing, it's not the end of the world. You have to dig out to find what's happening? If the free cash flow reduces because they are investing in stuff that will improve their revenue next year, it's a good thing isn't it? If the free cash flow is stable over the years, it just means that they are sort of in an equilibrium stage. The middle age to golden age of a company, where things are stable, not breaking into new industry or into new markets.


But ROE is part net profit and part equities. Let's see their equities.


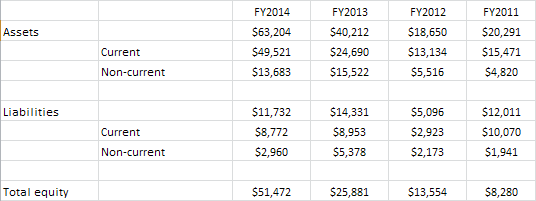
You notice that there's a huge rise in the equities in FY2014. How come? The assets increased a lot while the liabilities is reduced too. The equity doubled from FY2013 to FY2014. If the net profits remained the same during the same period, the ROE would have been halved! Since it didn't drop by 50% (from 33.7% to 25.6% in FY2014), the net profit must have risen proportionally higher.


Let's see its NAV (cents).

FY 2011  -- 3.31 cts
FY 2012 --  5.42 cts
FY 2013 --  10.35 cts
FY 2014 --  20.59 cts


Since the equity keeps increasing, of course the NAV also increases. Since the increment is the same as the rise in equity, the no of shares outstanding is not diluted too much. Indeed a check shows that it's the same since IPO (but it's only been a year since IPO, no big deal).


Here's the summary:


At last close, the PER is 5.3, P/B is 1.36 and yield of 4.3%.
Last year, it IPO at PER of 8.8, P/B of 3.0.

I want the readers to focus on the numbers alone without prejudice, hence I blacked out the name of the company below. If you highlight it, you'll see the company, haha! Also do take note that this set of financial results is not the latest. I just want to see the full year results to analyse the ROE - it's never my intention to recommend companies to buy.

The company name is: Starburst

Thursday, October 29, 2015

Jumbo Group IPO - Good buy or Goodbye?

Out of curiosity, I wanted to find out more about Jumbo Group Limited IPO. This is the group that is famous for their Jumbo Seafood and their signature Jumbo chilli crab, black pepper crab, salted egg golden prawns and crispy baby squids. They have restaurants under the Jumbo seafood brand in Singapore and PRC too. Besides this, they also have JPOT, Ng Ah Sio Bak Kut Teh, Chui Huay Lim Teochew Cruisine, J cafe, Yoshimaru Ramen Bar, as well as Singapore Seafood republic. Singapore Seafood republic is found in Japan, specifically Tokyo and Osaka.


To be honest, I seldom visit any of their restaurant brand. Even the famous Jumbo seafood restaurant at east coast (I live in the east), I've been there only less than 5 times in my entire life. It's always a touristy kind of place, and I don't feel like spending a lot of money to eat okok food. But that's just me. Neither did I visit Jpot, or Jcafe or any of their outlets, sad to say, haha!


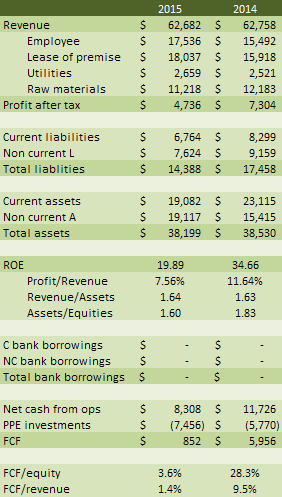
But what's impressive is their results. Since the finalised version of the prospectus is not up yet, I've to work on the preliminary one. Facts might change, but anyway, here's a summary of the key financials:


Here's a few key points:


1. Revenue had been rising, together with earnings after tax. This rise in earnings is not likely fueled by debts, as you can see from their Assets/Equities from 2012 to 2014. It seems to be driven by the greater profit margin of their business, which is always a good thing.


2. ROE at 23% to 26% is fantastic, especially so when they are not crazily leveraged. As a comparison, ROE of Oxley, the company that I recently covered while trying to decide whether their bond is a good buy or good bye here, shows an ROE of about 18% in 2015, but their assets/equities (a sort of financial leverage) is 6.81 times! Okay, granted, that's not fair since they are of different industries. Let's compare with other f&b establishments listed locally - Japan Food holdings and Soup restaurants.


Here's Japan Food holdings (figures in '000):


And here's Soup restaurant:


If we compare these 3 f&b places, we can see that the ROE of Jumbo is in a very good and envious situation. Jumbo's ROE is about 25% compared to Jap Food of about 20% and Soup restaurant of about 7%.


3. Great net profit margins. Their net profit margin varies from 8% to the more recent 12% in 2014. I think f&b business is kind of hard to have high profit margins, and Jumbo is doing a great job as a company (but ripping us off as consumers!). Their top 3 things in 2014 that reduces their net profit, besides tax, are raw materials and ingredients (43.3% of total cost), wages and salary (27.1%) and lease of premise (9%).

It's interesting when we compare with Jap Food holdings in 2015, because the top 3 cost are lease of premise (31,1% of total cost), wages and salary (28%) and raw materials (19.4%). So are Japanese food materials less expensive, seafood ingredient more expensive or somebody is serving us lousy ingredients? lol

Just for curiosity, the top 3 cost in 2014 for Soup restaurant are wages and salary (36.2% of total cost), raw materials and ingredients (23.9%) and lease (17.5%).


4. ROA or Revenue/Assets - this gives us how much profit they can generate from investing in their assets. It's not shown in the table, but Jumbo has consistent ROA throughout 2012 to 2014 ranging from 16% to 19.4% (in 2014). Very good, when compared with that of Jap Food, which is about 12 to 18% and Soup Restaurant of about 2 to 5%.


5. Jumbo do not have a lot of long term debts. Their total bank borrowings is about 4 to 7% of their total liabilities. One year of their net profit can cover their total bank borrowings 7 to 17 times over, so it's really not a concern. If you use their free cash flow (FCF), each year of operations can cover their total bank borrowings by 4 to 12 times. It's a very robust balance sheet that they have. Comparing with Jap Food holdings and soup restaurants, I'm quite surprised that F&B business do not have a lot of debts. Perhaps it's such a good cash business that they don't need debts to tide over their cash flow problems, if any.


6. Jumbo is generating free cash flow like crazy. I'm lazy, so I'm using FCF = Net operating cash flow - cash needed for PPE as a proxy. It's stable and consistent, can't ask for more.


It's hard to say if this is a good buy or good bye without knowing the ipo price. Since it's IPO - It's Probably Overpriced, but it'll be good to look at this again. What I like about Jumbo is that it's a cash business, not highly leveraged, great ROE, good net margins for a f&b business and best of all, fantastic free cash flow. What's not to like about it?


Perhaps the IPO price, lol

----------------------------------------
Latest update:

Many thanks to musicwhiz who told me that the IPO prospectus is now in Catalodge under SGX. Strange, I always thought that Opera is the place to find such prospectus. Anyway, with that finalised prospectus, things are a lot clearer.


They are listing it at an IPO price of $0.25


Here's some pro forma per share data:
NAV: $0.068
EPS: $0.027
PER: 9.3x
Dividend policy: No fixed policy. Intention to distribute not less than 30% of net profits in FY2016 and FY2017. 30% of EPS of 0.027 will be 0.81 cts, representing at least a 3% pa dividend if FY2015 earnings remain the same.


With an IPO price of 25cts, Jumbo is priced at 3.7 times of NAV. Let's compare the other two f&b enterprise listed here:


Jumbo NAV: 6.8 cts, IPO price: 25 cts (3.7x)
Japan Food holding: 2.5 to 2.8x NAV
Soup restaurant: 4.8x NAV

What about the PE ratio of Jumbo?

Jumbo EPS: 2.7 cts, IPO price: 25 cts (9.3x)
Japan Food holding: 15 to 22x
Soup restaurant: 4 to 6x


Looking at the ratios, the business of Jumbo seems more like Japan Food holdings than of Soup restaurant. If we go by that standard, then the PE ratio of Jumbo might ultimately trade around 15 to 22x, which means a price range of about 40.5 cts to 60 cts. I'm not looking at NAV because it's not really relevant in such a business.


They are putting out 2 million shares for public offer (for us) and 86.233 million shares for private placement. There's also 72.1 million shares (separate from private placement) taken by cornerstone investors (namely Orchid 1 Investments Pte Ltd by Heliconia capital management- 40 million shares, and Mr Ron Sim, CEO of Osim - 32.1 million shares). With only 2 million shares out for retail investors, this is going to be as hot and spicy as their signature chilly crab.


Verdict: Good buy, if you can get any. More likely you'll get insufficient number of shares to make it worth a stag after commission, haha!


Monday, December 08, 2014

DDM valuation for Blue-black Blue chips

Let's do some low ball valuation for a few blue chips, most of them beaten until blue-black.

I'm using a dividend discounted (DDM) model, with the assumptions:

1. Zero growth rate for dividend
2. Rate of return required = 5% (twice as much as CPF's OA account)
3. Dividends given till perpetuity
4. No special dividends included, unless they occur every year. I'll guesstimate in that case.
5. I'm using a geometric progression, specifically the sum to infinity with first term as the dividend at year 0 and the geometric ratio as the ratio between the 1st yr and the 0th year. The formula is:

Sum to infinity = First term / (1 - geometric ratio)

Here's an example of a company, ACME, that pays 100 cts dividends every year.


The sum is 100/(1-(95.238/100)) = $21.


Alright? Let's go:


1. ST Engineering

Dividends per share: 14 cts
Sum = $2.94
Price now = $3.36

2. OCBC

Dividends per share: 34 cts
Sum = $7.14
Price now = $10.33

3. DBS

Dividends per share: 54 cts
Sum = $11.34
Price now = $19.73


4. Kepcorp

Dividends per share: 40 cts
Sum = $8.4
Price now = $8.21

5. Sembcorp Marine

Dividends per share: 12 cts
Sum = $2.52
Price now = $2.92

6. SIA Engineering

Dividends per share: 20 cts
Sum = $4.20
Price now = $3.95

7. Sembcorp Industries

Dividends per share: 15 cts
Sum = $3.15
Price now = $4.16


Take away:


I highlighted the 2 companies where the current price now is lower than this low ball method of calculating the intrinsic value of the company. If you look at Kepcorp, this method gives a value of $8.4. This means that if you take it that Kepcorp is going to give you dividends forever at 40 cts per year, not a cent more or less, AND if you want a return of 5%, you should get it at $8.21. Any dividends above 40 cts is a bonus (because it's not included in the calculations) for you, so is any special dividend declared if any. So how sure are you of getting the 40 cts dividends? That's the ultimate question.

Monday, December 01, 2014

The relationship between ROE and ROA

Been reading a few books on finance recently to brush up some stuff. Things that you don't use it often, you'll forget. So I make it a point to re-read some of the books that I've read and also some books for newbies. It's important to learn as if you are a newbie even though you are not. You'll see things in different light.


Anyway, I was just musing over a key criteria in evaluating companies. Among other things, it must have:

1. High consistent ROE, > 15% over 10 yrs or more, or if 5 yrs, have a higher margin of safety

2. High consistent ROA, >7%, same time criteria as above


ROE is calculated by taking the net profits divided by the equities portion. You can find net profits in the income statement, usually right at the bottom of it (it's literally called the bottom line). Equities is found in the balance sheet. Equities is what you are left with after subtracting total liabilities from total assets. ROE itself changes depending on how much debt you use to leverage to increase your earnings, so it's very important to consider the debt profile of the company together with ROE and not just treat ROE as a stand alone matrix.


You can break up ROE into the following 3 components to better clarify what exactly drives the ROE.


ROE = Net profits/equities = Net profits/Revenue x Revenue/Assets x Assets/Equities


Net profits/Revenue is the net profit margin. It measures how many dollars you book as profits after subtracting all the costs of selling $1 worth of goods/services. It's important to realise firstly this might not necessarily translate into cash straight away because this is just an accounting profit. The actual cash might come in later (or not) and can be seen in the statement of cash flow. Obviously, the higher the net profit margin, the better it'll be.


Revenue/Assets is the component that measures how efficient your conversion of the assets to revenue. It varies widely from a company that sells goods to a company that sells services. Generally, a company that sells services are lighter on assets, so their revenue/assets ratio will also be higher than say, a company that sells shoes. Again, the higher the better.


Assets/Equities measures the gearing (some sort) of the company. Assets (A) = Equities (E) + Liabilities (L). If the company has a lot of debts, their liabilities portion will be substantial, thereby raising this ratio. Out of the 3 components, this is a ratio that might not be good if it's higher. Given the same ROE, a company with low Asset/equities ratio is generally in a better position than one with higher Asset/equities. With debts, you can leverage a higher profit, but it goes both ways too when the economic situation becomes dire. You can lose more than you owe. Short-term wise, with debts, generally ROE will be raised (but at what cost?) because it's just a product of the three components.


But I want to introduce ROA into the picture as well. ROA is defined as follows:

ROA = Net profits/Assets

It measures how efficient the company is at converting its assets into net profits. Generally, the higher the better. However, because the denominator is Assets, and Assets = Equities + Liabilities, essentially:

ROA = Net profits / (Equities + Liabilities)

Now compare this with ROE, which is:

ROE = Net profits / (Equities)

and you'll realise two things:


1. Mathematically, ROE is greater than or equal to ROA, because the denominator for ROA is larger or equal to that when calculating ROE

2. ROA approaches ROE when Liabilities approaches zero. For a company with zero debt, there should be no difference between the ROA and ROE


That was my hypothesis anyway. It formulated when I was at a coffeeshop waiting for my seafood hor fun and I got myself thinking after looking at the 2 criteria stated above (high ROE and high ROA) for good companies. I knew I got to test it out, so let's see it in real life cases.


It's instructive to compare 2 companies with similar ROE and then compare their ROA, after which we see their Debt/Equity ratio.


Observations:

1. The two green columns - ST Engineering and Sheng Siong - have very similar ROE at 26+%. That's very high. But notice also that while ST Engineering has a much lower ROA, Sheng Siong has a much higher ROA. If we look at the Debt/equity, we notice that ST Engineering has a lot more debts than Sheng Siong. This by itself isn't a red flag, but it's just something we have to take note of. Debt is only a problem if they have a problem paying it off. We can see that the high ROE of ST Engineering is partly fueled by its debts.


2. The two purple columns - GDS and Vicom - again have very similar ROE at around 22 to 25%, which is very admirable. This time, both have very low debt/equity ratio and thus their ROA matches very closely to their ROE. GDS especially, is a company that I didn't know existed until I tried finding a company listed in SGX with the lowest Debt/equity ratio. Having a high ROE (25%)  and a high ROA (19%) plus a good yield of about 3.8%, it's one of those small caps that might be worth while for investors to dig deeper.


3. The last 2 red columns - Sembcorp Ind and Hock Lian Seng - also have pretty good ROE of around 16.8%. But we can immediately see the difference in their ROA. Sembcorp Ind has still a decent 8% ROA but Hock Lian Seng's ROA failed the criteria of having ROA being 7% or more (it's 4.8% in 2013). And we can observe why - the debt/equity for Hock Lian Seng is much much higher than that of Sembcorp Ind.


Take away:

I think if we track the ROE and ROA trends of a company across years, we can uncover something interesting. ROE by itself is just a number; we have to check the quality of that number. If it's maintained by higher and higher debts, we can see it in their ROA trends too. Basically you don't want a situation where the ROE keeps increasing and the ROA keeps decreasing. A divergence of this two matrices means only one thing - the debt is piling up.


But of course, I still highly recommend the elegant Dupont's analysis of ROE that I've blogged about at length and summarised here. It clearly shows which of the 3 components are the ones that brings the bacon home and maintains the ROE.

Tuesday, November 11, 2014

Valuation of ST Eng based on order book

ST engineering had been dropping like crazy the last few weeks, and very recently in the last few days, the sell down persisted at a much greater pace. I know that they had a weak quarter, and possibly they will end this financial year with similar revenue but weaker net profits. My class got cancelled, so I had some time to crunch some numbers.

Here's a fancy 5 yr key financial data taken from their site:


A few things to take note:

1. The net profit margin (Net profit/Revenue) hovers around 8% in 2009 to 9% in 2012.

2. The number of shares taken to calculate the earnings per share (EPS) increases from around 30 units to around 31 units.


(What units? EPS is net profit over shares, so if you manipulate the formula you'll get shares = net profit/EPS. And that's what I did. I took the net profit for each year divided by the EPS to get the shares, but I can't be bothered to convert to the proper units. Not that it mattered later on when I use it for calculations.)


The 10 yr order book is provided in the annual report 2013 too. Here it is:


Since the share price of a company should be forward looking, knowing the current order book for the next 10 yrs should determine the current price of the shares now. What I wanted to find out whether I can use the order book to guestimate future revenue booked. Since I know the historical net profit margins, I can guestimate the future net profits. If I divide this by the number of shares unit by the company, I'll have the future EPS. Multiply EPS by the historical PE ratio, I'll have the future price range, and I can decide from there what to do with this garbage-in-garbage-out number so expertly calculated.

Let's go.

First, a little back testing. Since they have the 10 yr order book data for 2003 and 2008, I can use it to see if this is even worth the bandwidth posting. Here it goes:

Assumptions:
1. Share units of 31 (more conservative than 30)
2. Net profit margins of 8% (more conservative than 9%)
3. PE range from 10 to 20 (theoretically it should be 10 yrs, isn't it, since it's a 10 yr order book)

10 yr order book for 2003: $4.6b
Net profit for 2013: $368 mil (4.6*1000*0.08)
EPS for 2013: 11.9 cts/shares (368/31)

Using PE of 10, share price = $1.19
Using PE of 15, share price = $1.78
Using PE of 20, share price = $2.37


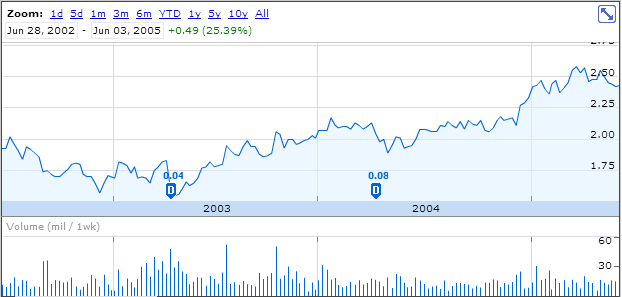
So, based on this order book estimation model, I get around the price range of 1.78 to 2.37. Let's tally it with the historical share price around mid 2002 to mid 2005. You can see that from mid 2002 to end of 2003, the price hovers around a range of 1.6 to about 2. Alright lah.


Let's try for order book for 2008.

10 yr order book for 2008: $10.6b
Net profit for 2018: $848 mil (10.6*1000*0.08)
EPS for 2013: 27.3 cts/shares (848/31)

Using PE of 10, share price = $2.73
Using PE of 15, share price = $4.10
Using PE of 20, share price = $5.47

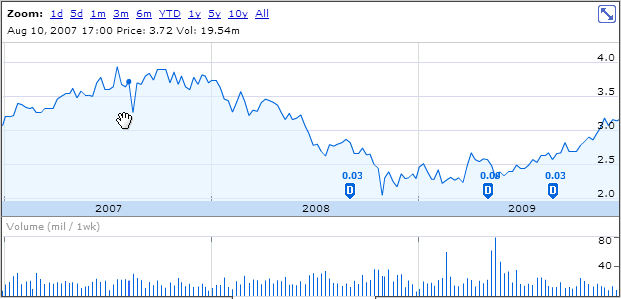
I attach the historical share price from 2007 to 2009 here. Price ranged from about 2 to 4. A little unfair cos it's the global financial crisis, so the PE is depressed by that event. I leave it to you to decide if you can use the order book as a suitable model of valuation based on this 2 samples.


Ah ha, here's what we've been waiting for. Let's try for order book 2013.

10 yr order book for 2013: $13.2b
Net profit for 2023: $1056 mil (13.2*1000*0.08)
EPS for 2023: 34.1 cts/shares (1056/31)

Using PE of 10, share price = $3.41
Using PE of 15, share price = $5.11
Using PE of 20, share price = $6.81


A big caveat here here is that this is of course a simplified model. I'm using net margin of 8% on any revenue booked, but it will change when the composition of the revenue is changed. It could be higher or lower. There's also another consideration - the dividend. Let's say the dividend, which is 15 cts now, will drop to 14 cts in the future. Based on 10 times PE, the yield will be a reasonable 4.1%, with the possibility of the share price 'upgrading' to a PE of 15, possibly booking another 50% capital gain.


My second tranche of averaging down will be a little more pessimistic. Here's a chart that I did quite some time ago before all the plunging of the share price recently.


3.3+ to 3.22 will be where my bullet is aiming. I'll see how it reacts around 3.3+ first before deciding further. And how did I react to the falling share price? Nothing. Unlike the past, I didn't put in more than what I can afford to lose, and this is not an s-chip like longcheer or china milk or ferrochina.


What a journey it had been from then and now lol!

Monday, September 29, 2014

The 3 components of ROE

I've written in the past about the dangers of relying solely on ROE calculations. The danger comes from not knowing the components that makes up ROE. For the uninitiated, it refers to a matrix called Return on Equities.


Not this roe lah!

I think it's important to use Dupont analysis of ROE to break up the components of ROE into 3 main categories:


  1. Financial leverage = Total assets / Equity
  2. Assets turnover = Revenue / Assets
  3. Net margin = Profits after tax (PAT)/ Revenues


If you take the 3 ratios above and multiply them, you'll find that the denominator and numerator of most components will cancel each other, giving you :


ROE = Total assets/Equity x Revenue/Assets x PAT/Revenues = PAT/equity

That is the standard formula for the computation of ROE


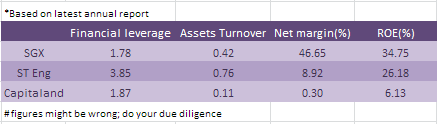
Let's use some concrete examples. I randomly take 3 STI components, SGX, ST Eng and Capitaland. They have nothing to do with each other (in terms of the business they do). The only commonality is that they have easily accessible annual reports so that I don't have to plow through everything to get the numbers required. Lazy, I know :)


So here it goes:


If you look at the ROE component, you'll have realised that ST Engineering's ROE is high because it is more highly geared up. Basically with leverage, you'll have a multiplier effect on your gains or your losses. That's not necessary bad, it's just that if you compare ROE alone, you'll miss that fact.


Again, if you look at the ROE of SGX, you'll find that the main component driving it is actually it's high net margins. That super delicious net margins pushes up the ROE. That is not necessary good or bad, it's just something that might not be noticed if you just focus on ROE alone.


You can dig more about ROE in my previous post here. The real important one is the 2nd link, but it's riddled with broken links of pictures...argh..

1. Dupont analysis of ROE
2. Woe be to those who missed out ROE
(I apologise for the lack of pictures...the server that I had uploaded the pictures went bust...so it's gone)

Thursday, July 03, 2014

Starburst IPO

I happened to chance upon this soon to be IPO-ed catalist listed company called Starburst. I must have found what they are doing interesting because during my last reservist, I went to a indoor range with artificially controlled lighting (that means you don't have to wait for night for night shoots) and was suitably impressed with the construction and professionalism (I think they are run by CISCO) of the people there.


Business

Starburst is a Singapore based engineering group that specializes in design and engineering of firearms-training facilities. They have a track record of 15 yrs in the industry. Their 3 main business segments are


1. Fire arm shooting ranges - They design, fabricate and install their proprietary anti-ricochet ballistic protection systems for indoor, outdoor and modular live firing range, close quarter battle houses and method of entry training facilities. It's not stated anywhere that they are involved in the firing range that I went to in my last reservist, but from the pictures provided in the IPO prospectus, I'm quite sure they are involved.

2. Tactical training mock ups - They design, fabricate and install those simulations scenario, like sniper tower and counter terrorism operation training

3. Maintenance services and others - Basically design, supply and fabricate structural and architectural steel works, also maintain facilities.


Among the 3 segments, this is the one that is recurring in income. The other two are one-off and therefore their revenues are going to be lumpy. They stated that they are going to increase their maintenance services segment so as to provide more earnings visibility. I think that's a good move. The other business segments doesn't provide that kind of assurance to investors.


Revenue breakdown FY2013 FY2012 FY2011
Firearm shooting ranges 14639 (69.6%) 16188 (93.4%) 21211 (93.3%)
Tactical training mock ups 3460 (16.4%) - 351(1.5%)
Maintenance services and others 2946 (14%) 1149(6.6%) 1172(5.2%)

Ratios

Take a look at their ratios:

FY2013 FY2012 FY2011
ROE 33.7 47.7 72.6
Profit/revenue (net margin) 41.5 37.3 26.4
Revenue/Asset (asset turnover) 0.523 0.930 1.120
Assets/equity (leverage) 1.554 1.376 2.451
EPS based on post IPO share base 3.49 2.59 2.41

The kind of business they are doing certainly have huge margins! You're talking about 26 to 41% net margins here! ROE is a strong double digit for the last 3 years. I think in FY2011, the ROE is artificially raised because of the higher leverage which they used (look at their assets/equity of 2.451 in FY2011 vs 1.554 in FY2013).


EPS of 3.49 cts in FY2013, and their IPO price of $0.31, means that their PER is about 8.8 times, which is not excessive. What's the weighted average PE of STI index? It's 15.1, according to this. Starhub has a PE of 19.4 while DBS has a PE of 11.3, to give you a feel of the PE ratio of different big companies you know. The NAV before adjusting for the IPO proceeds is 12.94 cts, so the P/B is about 2.4. ST Engineering, a company with about the same industry as Starburst, has a PE of 20.4 and a PB of 5.29.


Revenue

FY2013 FY2012 FY2011
Revenue $21,045 $17,337 $22,734
Profit before income tax $10,107 $7,641 $7,145
Cost $10,938 $9,696 $15,589
Finance cost $82 $135 $308
Project/production cost $8,412 $6,682 $11,558
Net profit $8,729 $6,464 $6,013


Revenue is lumpy, given the variability of the contracts they can secure in their order books The cost seems very contained, giving them a very high profit margins. The majority of the cost is the project/production cost, accounting for about 70 to 80% of the cost. Take note that a majority of their employees are foreign workers (77% as of 31st Dec 2013), so they are also going to face the same issue as all SME with regards to the labour policy and shortage. 


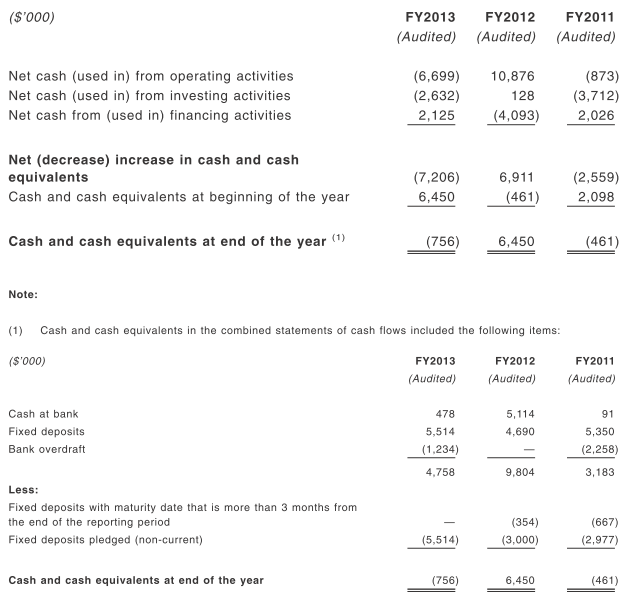
Cash flow


Operating cash flow is again lumpy, and highly dependent on whether they secure projects. The payment for the projects are based on percentage of completion, and the contracting party can retain 10 to 20% of contract sum upon completion of works in order for them to assess shoddy work or work-yet-to-be completed. I guess that's standard practice, like all construction firms. I'm not very good at analysing cash flows, so I won't even try. 

FY2013 FY2012 FY2011
Assets $40,212 $18,650 $20,291
Current  $24,690 $13,134 $15,471
Non-current $15,522 $5,516 $4,820
Liabilities $14,331 $5,096 $12,011
Current $8,953 $2,923 $10,070
Non-current $5,378 $2,173 $1,941
Total equity $25,881 $13,554 $8,280

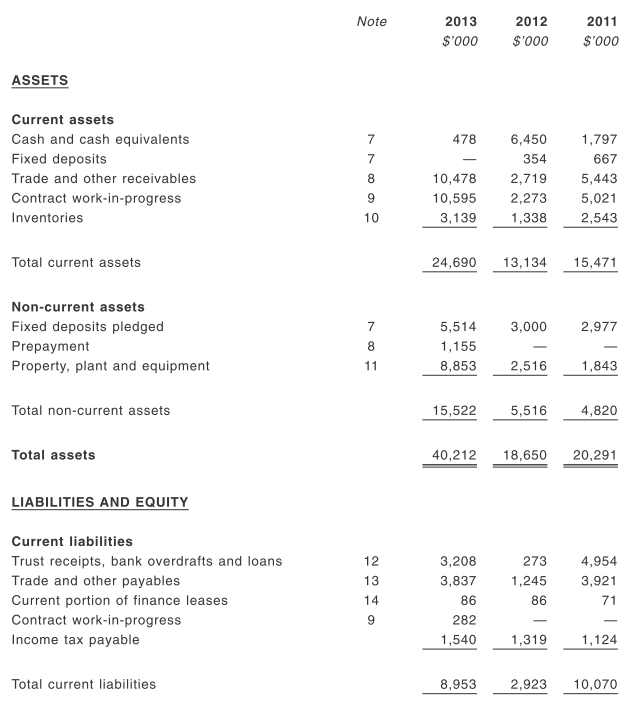
But based on their balance sheet, their current ratio is pretty healthy. But not all their current assets can be liquidised to pay off short term debts. Let's see the breakdown of their assets:


I think most of their operating cashflow in FY2013 is locked up in the form of contract work in progress and also other receivables. Once they convert that to cash, their operating cash flow should improve greatly. But in the meantime, I don't think they have issues with paying off any short term debts. Their receivables turnover for FY2011, FY2012 and FY2013 is 55, 16 and 10 days respectively. They said it's attributable to their stringent internal controls policy...okay, anyway, it seems really alright.


Dividends?

Any dividends? They are giving out at least 20% of their profit after tax as dividends in FY2014. Their order book for the firearm shooting ranges and tactical training mock ups is 19.7 million, which will be translated into revenue over the next one year (it's about there, if you add up the trade and other receivables and the contract work-in-progress for FY2013, you'll get about 20 million). As for maintenance services, they said that it'll be approximately 26.1 million, which will be translated over the next 1 to 19 years. I don't think you can add up 19.7 million to 26.1 million to give you 45.8 million in order book for FY2014. I'll just divide 26.1 million by 19, THEN add to the more or less confirmed 19.7 million, to give a estimated revenue of FY2014 as 21 million. That's also about the same revenue as that earned in FY2013.


Their net margin is about 40%, so that means their profit after tax in FY2014 is about 0.4 x 21 = 8.4 million. 20% of that will be distributed as dividends, so that's about 1.68 million, or 0.672 cts per share. The offer price is 31 cts, so that's going to give us a dividend yield of around 2.17% pa. Ah, you have to compare with ST engineering, which gives a yield of about 1.8% pa. This is after all a 'growth' company, so don't expect lofty yields of 5 to 6%. You should be looking at capital gains instead.


Competitive advantage

They listed down their local competitors, namely Cubic Range (listed in US), Meggitt Training systems (pte), Microcircuit systems (pte). The industry is such that a main contractor will bid successful for a project, then they will sub tender to others, so there's a fair amount of cooperation  between all the competitors. As for Cubic range, I read through their annual reports but it's not a fair comparison since they do a ton of other things as well. If you must know, their latest net margin is about 1.4% only, compared to Starburst's 30 to 40% net margin. 


There are of course other competitors internationally, since Starburst is also going overseas in middle east to bid for contracts.


Their main advantage over the others seems to be that they can fabricate and install bullet containment systems using their proprietary IP. I don't know how great that is, but from their net margins, it does appear to be quite unique. If only I knew about the margins of the other players...


The defense industry is likely to be very recession proof. I just don't see defense budget being cut...at best it'll be kept the same. And we're talking about big players - government or defense ministry - who command huge budgets. I think it's a good industry to be in with huge barriers of entry. You can't just apply to build such things because you need to have a good track record and have the relevant certification level, and Starburst's 15 years of experience in the industry should count for something.


Why are they doing it?


The two founders are going to hold 80% of the shares, with the remaining 20% of the shares (all 50 million of them) for the public. In the IPO, only 4% (a mere 2 million) of the public tranche is for retailers in the IPO. The remaining 48 million are up for placements. As usual, the controlling founders cannot sell their shares before the six months period is up. They must also hold at least 50% of their holdings for another six months. 


A big part of the proceeds (all 45% of it) is going to be for acquisition of leasehold land and buildings. The next big part (37%) is for general working purposes. I just don't know why they want to IPO it. Perhaps the two founders want to take back their capital and liquidise their holdings (don't they all?)


Worth getting?


I think this is fairly valued, and certainly not a sucker's deal. But the problem is getting enough of it to matter during the IPO. In the IPO, it's likely to be very hot, given the low 4% available for us mere mortals to bid. With 20% of available shares available for trading in the first 6 months, I think this is going to be those illiquid counters with huge movements. I'm going to take a second look once it's properly listed and all. Closing is on 8th July 12 noon. Trading will start next Thurs, 10th July.

Tuesday, December 31, 2013

Sg bonds listed in SGX

This is the last of the 3 part series detailing all the fixed income listed in SGX. For those who just came in to read about this article, a little background of why I'm doing this. I'm trying to plan out my parent's retirement fund. They gave me 50k not too long ago and I guaranteed a 2% pa, capital guaranteed LP bond to them, so I'm fulfilling my part of the bargain by doing the necessary background research in order to make their money work harder for them. Since I'm already put in the time and effort, I might as well share it with others.


Here's the first 2 part of the series:

1. Retail bonds listed in SGX
2. Preference shares listed in SGX


First of all, about the terms bills and bonds. Bills refer to short debts (< 1 yr maturity )issued by the government while bonds are longer debts (>1 yr maturity). In my post, I'll treat all the debts issued by SG govt as bonds, to make it simpler.


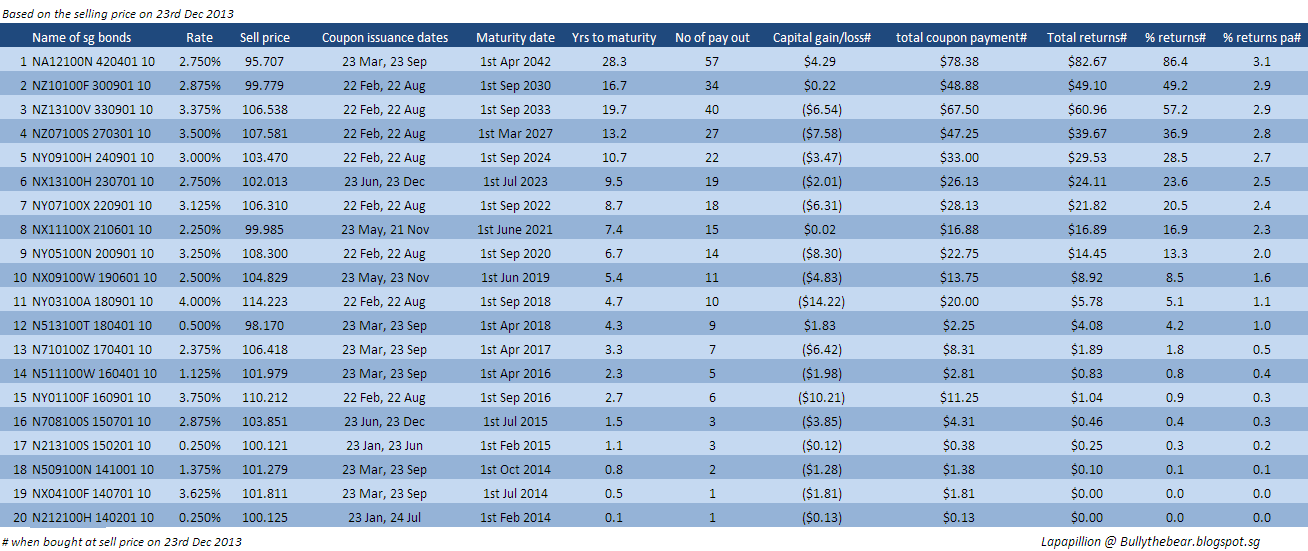
Here's the chart that I've compiled:


Click to enlarge. I might be wrong, so do your due diligence.


A few comments:


1. You'll notice that the yield are not fantastic, ranging from a coupon yield of anything between 0.25% to 4% pa. The yield, if you bought it at near current price, is worse off. Almost all the bonds are traded above par, so you'll get lower than the coupon yield listed on the name of the bond. This range from near 0% to 3.1% max. Usually for fixed income, the yield is inversely proportional to the perceived risk of the underlying issuing the debt. Since SG govt is quite unlikely to default, don't expect their yield to be like those in the Eurozone. You'll also notice that in general, the longer the maturity date, the higher the yield too. This is because the longer the period that you're holding the bond, you're exposed to more circumstances possibly leading to the bond being defaulted, hence you should be compensated for taking that greater risk.


2. We all know that in the near future with US stopping or reducing their printing, the interest rate environment would not be the same as it is now. It'll probably rise up, and that's a near certainty. Just how much and when. If you hold a bond till maturity, you don't have to worry about the rise of interest rate and the fall in price. Whatever yield you get is calculated at the extreme right of the chart above, because I've included the gains/loss due to the difference in par values and the market price of the bond. That being said, you'll notice that shorter maturity bonds are less sensitive to interest rate risk. So, if you're looking to put some money while waiting for the market to crash, for example, you might want to put into shorter term bonds. This way, you can still switch between asset class towards equity when the need and circumstance arises.


3. How safe are these instruments? If you treat fixed deposits as the ultimate safest, then sg bonds will rank right after it as the second safest. The difference in risk between the safest and the second safest is probably just a tiny gap, because even banks invest the money that you deposited with them in the fixed deposit accounts with Sg bonds, possibly along with other high grade bonds.


4. I would really like you to consider looking at those bonds between number 8 and 10. A typical fixed deposit with local financial institutions will be around 1.25% (possibly less) pa. If you lengthen your investment horizon to 5 yrs, you'll get around 1.6% pa by buying bond number 10. Increase a little more to 6.7 years, you'll get around 2% pa by buying bond number 9. I know it's nothing to shout about, but for those who have stashed aside a sum of money for wedding or for some major event happening in the near future (like within 6 years), then this is not such a bad place to park your money. With this short horizon, it's silly to put it into the stock market. You might lose the cost of a wedding banquet because you want to earn the interest to buy a rose!


This is not the only way to get sg bonds. The other way is to bid for it. I've never done it before, but I've seen such an option in internet banking. You can also get it through fundsupermart but there are fees involved.