Learnt a few neat trick, so going to try it out on longcheer now.
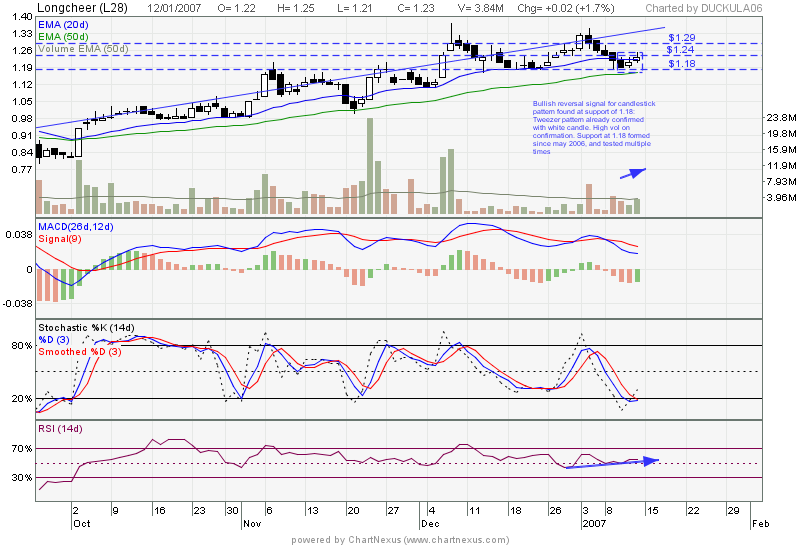
I drew a support line way back from mid 2006 at 1.18. Since it has been tested multiple times, I'll say this is a good and significant support. Longcheer has tested the dynamic resistance provided by the trendline (slanted line) and pull back all the way near support at 1.18/1.19. Look at the candlestick pattern, it is a tweezer pattern confirmed by white candle with high vol. on 12th Jan. Currently, it is closed at near term resistance of 1.24. Should it break this near term resistance, it should also have broken the ema20 days convincingly for me to believe that longcheer is on the uptrend again.
MacD histogram shows a green histogram with both lines above 0, after a period of 5 red histograms. To me, it is a sign that bottom has been reached and selling should have been finished. Ideally, both blue and red lines should be trending upwards but i guess for short term it's okay.
Stochastic look excellent, %K between below 20% and rebounded upwards, exceeding both %D line. More upside to come till it reaches the 80% mark.
RSI starts to look more like an uptrend now, and it recently tested support at 50% and rebounding from there. A short term upside is to be expected.
This is what I'll do. Monday, I expect it to gap up, so I'll buy some, preferably at 1.23 or lower for intraday. As long as it closes above 1.24, I'll be sure of more upside. Support is at 1.18. I'll risk 0.05 with a potential reward of reaching 1.29(next resistance) to 1.35/1.36 (trendline resistance). So that's a risk/reward of 1:1 at least. I'm willing to risk $500, so it works out to be 10 lots.
Before anybody buys, let me warn this: weekly chart don't look safe. Looks like it will hit lower within next 2 weeks to 1.18. But short term is good.
After all the analysis, will I suffer from analysis paralysis? Nah...i'll buy 5 lots first to test my analysis. If successful, i'll be confident to follow my analysis. Risk $250 to earn at least $250 (could reach up to $600) shld be good risk management.
IMPT:
Entry point : 1.23/1.24
Cut loss : 1.18 since it's such a strong resistance (tested 3 times) turned support (tested 2 times) that spreads over 3 months


0 comments :
Post a Comment