
Source:
The raw data of ^STI is taken directly from Yahoo! Finance site here. The adjusted closing price is used and according to the same site, it refers to the closing price for each day adjusted for splits and dividends.
Calculation of yearly returns:
I take the adjusted closing price of the last market day of each year, divided by that of the first market day of each year, then subtracted by 1 and multiplied by 100%. Each calculation is rounded to 0 decimal places. Dividends are also not included in the returns, so are the costs of ownership and brokerage.
For example,
Adjusted closing price for 2012 (31st Dec) is 3167.08
Adjusted closing price for 2012 (3rd Jan) is 2688.36
[(3167.08 / 2688.36) - 1]*100% = 18% (0 decimal places)
Since 2013 is not yet over, I use the latest adjusted closing price for 5th Dec 2013 to estimate the yearly returns. Unless something drastically happens, I think it should be a fairly good estimate.
Results:
Here, this is how it looks like for our STI:
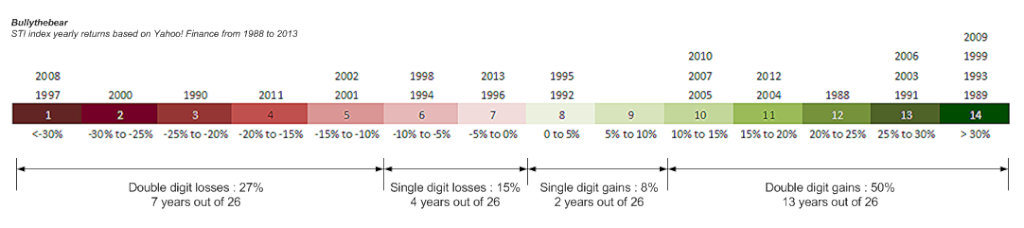 |
| Yearly returns of STI from 1988 - 2013. Click to see a bigger version. |
Observation:
1. It's interesting to note that there's a general bias towards gains throughout the (short) history of STI. 15 out of the 26 years recorded (58%) are gains, while the rest of the 11 years (42%) are losses.
2. 1 out of every 2 years (50%), there'll be a double digit gains. If you look back at Drizzt's blog, it's about the same for DJ (49%). On the other hand, 27% of the time, there'll be a double digit losses for STI, compared to 22% chance of double digit losses for DJ. As mentioned in point 1, there's an inherent bias in the index towards gains.
3. For STI, 15% of the time, there's more than 30% gains. To give an illustration as to what a feel of 30% is, consider for a moment that for a base of 3000, a 30% gains will be 900 points added, so that's quite a massive increment yearly. On the other hand, about 8% of the time there'll be a more than 30% losses. To compare with DJ, it's 6% of the years having more than 30% gains, and 5% of the years having more than 30% losses.
4. The median returns is 6.6% and the average returns is 8.8% (it has, however a standard deviation of 29.1% - which means it's as volatile as a boat out in the sea on a typhoon).
5. For those years that posted a yearly gain, the median gain is 24.6% while the average gain is 27.8% (with standard deviation of 21.3%). For those years that posted a yearly loss, the median loss is 14.4% while the average loss is 17.9% (with standard deviation of 12.4%). It's funny to see that the losses are more consistent that than the gains.
Thoughts:
Does it mean that we should scramble and go get STI index straight away? Well, yes and no. Do take note that while the results here suggests that it's more likely to have gains in STI every year, implying that you'll gain more likely than you lose if you hold STI, the results are based on a yearly returns. This means that you'll have to buy at the start of the year and sell at the end to mimic this result, assuming that the past is any indication of the future. If you hold STI over a period longer than 1 year, your returns will vary significantly from the results shown here.
Let's pretend that you have $100 in year 0. After you lose 30% of it in year 1 and lose 30% of it in year 2, you still lose 9%. In other words, timing and the holding period matters a lot. I blogged about this years ago here and here that if your average holding period is 14 years, then you're safe from having negative returns (there's some assumptions in this conclusion too). Any shorter period of holding may result in a negative returns or it may not. It depends on your entrance price and exit price. In other words- timing.
I guess the take away is that if you want to do dumb-idiot-proof averaging (I'm not against it, btw. In fact, I'm quite for it if you don't want to care a hoot yet want to have a reasonable returns for your money), then you better choose a stock that is inherently bias towards safety. And what safer stock is there then index because of all the gains-bias and survivor-ship bias? Since the underlying is already there, you just need to worry about the cost. Find the lowest cost of holding index and you can just carry on your life with other more interesting stuff compared to finance and investing.


6 comments :
Diversify evenly with dividend yielding stocks over XX years should be able to earn reasonable return.
People who lost money in investing are people who take big risk by averaging down till no return
Hi bro8888,
I think the problem is people want to be lazy yet they want reasonable returns. I think if they want to be lazy and averaging down without much thoughts, then indexing is the only way to go. Just keep buying - it should do fine and doing so really eliminates a lot of the risks of holding individual companies.
Not sure. How many people are lazy but not panicky to sell at market low.
LOL!
Hi bro8888,
Well I guess they have to be lazy when buying and lazy when selling too! haha
Anyone knows somebody has been doing this with success?
Curious to know.
Investing in STI ETF is a no brainer.no need to do TA, FA, or see balance sheet. I am vested not only in our index, but index of Asean stock mkt. My return is just as good.
Post a Comment