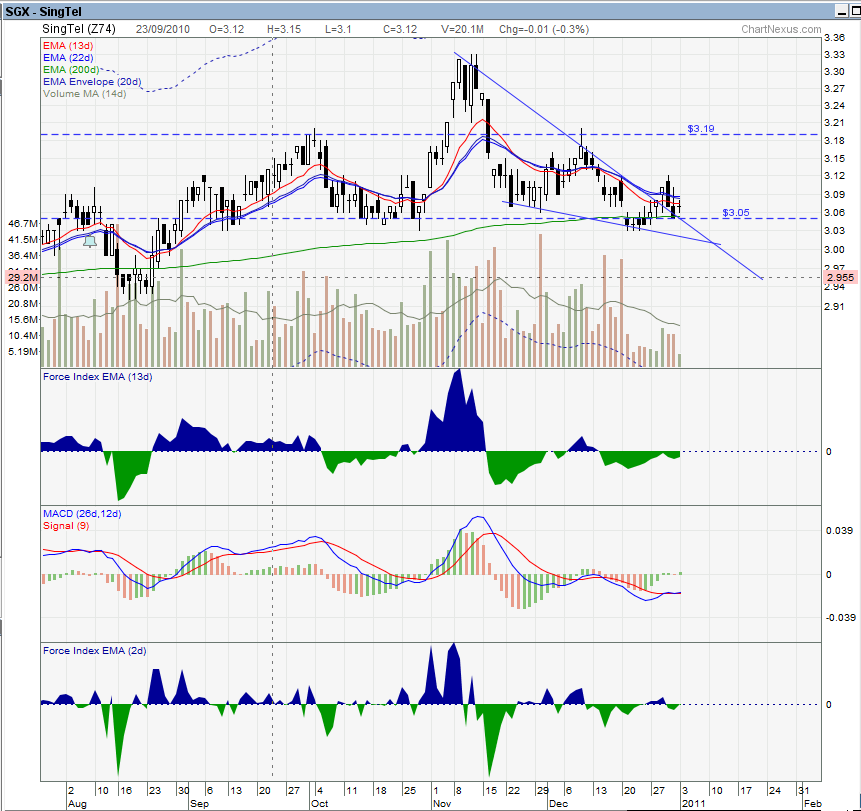
Singtel
Thought this is quite a nice chart to look at. There's a descending wedge (with declining volume) and upon breakout of the upper trend line with higher volume and subsequently re-testing it, it seems that it's a good bet. Could be a gap cover too. Expected target is 3.19 thereabout, entry 3.04 to 3.05. Capital requirement is quite high for this counter, so the returns are not as high as a percentage.
If the price goes below the lower trendline, especially with high volume, then the pattern fizzles out. So, I'll be looking at a strong support near 3.04. Goes below that, bullishness associated with the pattern is gone. As usual, this is not a recommendation to trade. I'm simply looking to see if my skills in TA are sharp or not.
Trying to Make Sense of DBS’s 18% Return on Equity
12 hours ago


4 comments :
dear lp,
pls pardon me for my ignorance but i see a bearish head and shoulders pattern on the singtel chart. or is there not?
Hi anonymous,
Now that you've mentioned it, I saw the h n s pattern you're talking about. I think the neckline is at 3.05, so if it fails to break down convincingly with high volume, it's not counted. It adds to the overall picture actually, thanks for pointing it out to me :)
Heh I didn't see the head and shoulders too. All I saw was the wedge as well.
http://therichkidwannabe.blogspot.com/2010/12/singtel-rebounds.html
The one thing I learnt from that is when chart reading, turn off all indicators first so that it doesn't cramp the prices thereby allowing you to observe any patterns first. Only after doing this should the indicators be included to back up any hypothesis on the price movements.
What's a gap cover btw? Never heard of it.
Cheers,
~K
Hi Kay,
Check this out on gap:
http://stockcharts.com/help/doku.php?id=chart_school:chart_analysis:gaps_and_gap_analysi
It's certainly not the shop selling clothes! :)
Post a Comment