
Tuesday, August 19, 2008

Thoughts about STI part 2

Was nudged by millionairemind to do a little investigation into the total returns of STI should year 2008 fall by 20%. Since I have not been checking STI absolute value (I did check the daily relative % drop/rise though), I was quite surprised that since the start of the year, we've dropped a cool 20%.

I did post a table with the values of all the CAGR for different years from investing in STI, in this post. I think this time, I better list down my assumptions for calculating the values:


1. Most importantly, the data is taken from Yahoo! finance website. The price is adjusted closing price.

2. The CAGR (compound annual growth rate) is calculated like this:

To find the CAGR from period A to period B:

CAGR = (price at 31-dec of period B / price at 1st-jan of period A)^(1/(B-A)) - 1

If market is not opened on 31st Dec or 1st Jan, the price of the market days closest to the dates will be taken instead.

3. The AVERAGE CAGR is calculated by taking a simple average of all the CAGR of the same period i.e. sum of all CAGR of the same period divided by the number of CAGR taken.

Below is the table calculated for the returns on STI for different periods, assuming that 2008 closed on 31st Dec at 2769, a 20% drop from 1st Jan 2008:


For comparison, here is my earlier table posted, without taking into account 2008:


Here's what can be observed:

1. Average CAGR dropped across most periods. 'Most' is the keyword. Average CAGR for 5-yr, 7-yr, 10-yr actually increased. I don't ascribe any significance to this fact, because of the way I computed the CAGR. I took 1st Jan and 31st Dec as the price for each period of calculation, so I'm very sure that if I changed the starting and ending period to take the price (say, using 1st June to 1st-June next year), the whole data will change.

2. Adding data for 2008 still doesn't change the fact that after investing for 14-yrs, there is not a single year of negative CAGR. This means that based on historical data, if one invests in any year in the past, for 14 years starting from 1st Jan and selling on 31st Dec of the 14th year, you will not make any losses. But the returns are a pathetic 3.1% per annum (on average) for a period of 14 yrs.

Again, this would most definitely change should I change the dates where I calculate my CAGR for different periods.

3. This much I can conclude: Investment period and Average CAGR seem to follow a U-shaped curve. There is a period of declining average CAGR from 1-st year till around the 10-14th year, beyond which, the average CAGR increases with period of years invested. However, the shorter the period of investments, the more volatile the the returns are. Conversely, the longer the period of investments, the less volatile the returns will be.

4. Here's a very interesting observation when I break down the percentage of getting positive CAGR for different investment periods.

------Years----total number of samples----number of +CAGR-----% of +CAGR
-------1 yr-----------------21---------------------12---------------------57%
-------3 yr-----------------19---------------------14---------------------74%
-------5 yr-----------------17----------------------12---------------------71%
-------7 yr-----------------15----------------------10---------------------67%
------10 yr----------------12-----------------------9----------------------75%
------12 yr----------------10-----------------------9----------------------90%
------13 yr-----------------9-----------------------8-----------------------89%
---14 yrs onwards---------------------------------------------------------100%

It's quite obvious that the longer the period of investments, the lesser the number of years in which one gets negative returns, no matter which year they started the investment. As mentioned, on the 14th year onwards, all the sample data gave positive CAGR.

But all these mean nothing if the percentage of losses in sample data is greater than percentage of gains in sample data. What I mean is that even though, based on past data, there are greater chances of getting +ve returns no matter what investment periods I choose, I can still lose money if the % of losses in losing years are greater than the % of gains in winning years.

Let's see this table:

------Years----Average gains of +ve years^----Average losses of -ve years#
-------1 yr-----------------28.1%---------------------16.2%
-------3 yr-----------------12.3%---------------------10.3%
-------5 yr-----------------9.8%-----------------------5.2%
-------7 yr-----------------7.6%-----------------------3.8%
------10 yr-----------------4.4%-----------------------1.7%
------12 yr-----------------3.2%-----------------------0.3%
------13 yr-----------------3.3%-----------------------0.8%
------14 yr-----------------3.1%
------15 yr-----------------3.6%
------16 yr-----------------4.6%
------17 yr-----------------5.0%
------18 yr-----------------5.5%
------19 yr-----------------5.6%
------20 yr-----------------6.3%

^ average gains of +ve years means the simple average of all the gains made for that particular years of investment
# average gains of -ve years means the simple average of all the losses made for that particular years of investment
* There are no average losses data for 14th year of investment periods and beyond, because there are no -ve years.

I am quite surprised by the results. Not only are there higher probability of getting positive years, the average gains for every data for different investment years yield the same results - the average gains of positive years is much more than losses incurred in negative years. But of course, average doesn't mean anything. On average, each family in country X has 2.2 children doesn't really mean they really have 2.2 children. The same logic applies here.
Sunday, August 17, 2008

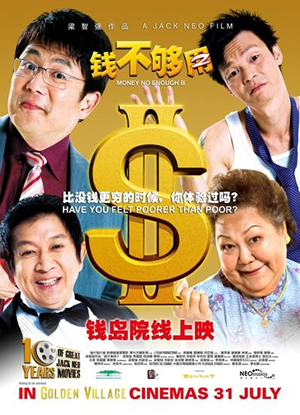
Money No Enough 2

I watched Jack Neo's Money No Enough 2 today.


To summarise, I do not like it at all. The summation of the cheap feel of the CGI, predictable plot lines and the usual ranting of pet topics makes it not worth the premium ticket price to watch this movie on a weekend. Fortunately, I watched it at a discount movie theater, which showed the movie at only $7, so it's not too bad to whilst one's time away for 2 hours.

It's rather ironic to see the cinema pretty crowded. The cinema, because of the rather uncomfortable seats, acoustically challenged sound system and the occasional hiccups (damn, I encountered the hiccups today when I watched the show; for a cool 5 mins, there are not sound at all) means that there are usually not many people in the theatre. To see so many people watching a movie titled 'Money No Enough 2' shows that people do have money to watch such cheap thrills.

The movie did not disappoint. Characteristic of Jack Neo's movie, it is a sequence of little skits not dissimilar to his past Comedy nights, aired on Monday Channel 8, shown every Monday. Despite the crowd's laughter, I do not find the show funny at all. In fact, it's quite a sad movie for me.

The movie showed all the familiar situations where Singaporeans are trying to earn money. I was a little taken aback when I watched that spending a night in ICU at private hospitals will set one back by 8k a night. I wonder how I can afford such expensive 'hotels' with or without insurance (specifically, H&S). Ouch...spending 3 nights will erode one's net worth by $24,000...scary thought.

I think I've said enough for this film. If you can, try not to watch it. Another irritating thing about the movie - when is Jack Neo's movie not a happy ending?

Friday, August 15, 2008

China milk 1Q09

China milk's 1Q results are out.

Only have time to browse through press release and power point slides. I'll do a more detailed analysis when I've the time.

To summarise:

1. EPS increased from 0.11 RMB in 1Q08 to 0.14 1Q09, a 27.3% growth

2. Revenue grown from 124.2 mil RMB to 158.4 mil RMB, 27.6% growth

3. NAV rose from 2.46 to current 2.61 in 1Q09

4. announced JV with a govt owned bureau and a third party (unnamed) to acquire like 200 pedigree bull sires. That's 140 mil RMB investment with 40% stake - all self funded

5. raw milk processing, OEM basis, will be out in 2Q towards end of year

6. Interim dividend declared, around SGD $5.60 per lot


Quick thoughts:

Not sure if they are going to give interim dividends for the next 3 quarters. If they do, that will give an annualised dividend yield of around 3% at last closing price. Great growth from EPS - what's good is that they are not as badly hit by rising material cost as other companies. In fact, they played the inflation game pretty well. Read that they had to buy more fertillisers as they do not have enough generated internally - will this be a long term running cost for the company? Have to read more.

The raw milk processing, having being delayed for some time, had been finalised to be 2Q towards end of this year. Let's hope no more delays now. The announced JV with Heilongjiang govt, with china milk taking a 40% stake, will see them acquire 200 pedigree bull sires. This will strengthen their monopolistic status on their sperm business...a very good sign to me.


Quick valuation

EPS at 1Q is 0.14 RMB. Annualising it gives us SGD 0.112. At last closing price of 0.695, that's a forward PE of 6.21x. Not sure if this is high or low, cos this must be the first time I'm analysing their results. Price is around 1.3x NAV value too. Considering their high current ratio and low gearing, this company will have no solvency issues in the near future.

------------------

Thks to littlecupid, who pointed out that my PE calculation for china milk is wrong. It read as 16x initially but I've changed it to the correct 6.21x now.

Thursday, August 14, 2008

Swiber 2Q08 results

Swiber released their 2Q results today. From the looks of it, it seems like they did very well, with net profit (mind you, not revenue) shooting up 258.1%. 2Q revenue is 82% of total revenue achieved in the whole of FY07 and 2Q’s earnings had already overshot the whole of FY07’s earnings. But I’ve learnt never to take press release so literally, so it’s best to pore over the results and ignore all the hype in the press release.

Let’s ignore the 2Q results and talk about the half year results straight. Why? This must be the first time I’m studying Swiber’s results though I’ve been holding this since 2007. Tsk tsk, so many things to do, so little time…

In USD’000,
-----------------------------------1H08------------------1H07
Revenue----------------------195,402-----------------44,676
Gross profit------------------50,638------------------12,767
PATMI------------------------31,119-------------------9,943

Gross margin-----------------25.9%------------------28.6%
Net margins-------------------15.9%------------------22.3%

Current assets----------------310,267----------------235,610
Total assets-------------------639,375----------------370,040
Current liabilities-------------218,711---------------109,730
Total liabilities----------------424,443---------------192,561
Equity (after MI)-------------212,857---------------176,872

Current ratio-------------------1.42---------------------2.15
Total debts to equity---------1.99----------------------1.09
ROE----------------------------14.6%-------------------5.62%
EPS (US cents)----------------7.33---------------------2.69
NAV (US cents)--------------50.16--------------------41.68

Net cash from operations---18,482-----------------2,938
Net cash in investing--------117,106---------------13,043
Net cash from financing-----52,591---------------13,682


My take:

A few things stand out from a simple comparison of 1H08 and 1H07 results. These are:

1. Revenue in 1H08 is over 4 times that of 1H07

From their foot notes, they mentioned their increase in revenue is the results of revenue derived from offshore construction projects. In 2Q08, Swiber executed 6 projects simultaneously over Brunei, M’sia, and Indonesia, compared to just 2 offshore construction projects in M’sia and Brunei in 2Q08. Two things to take from here – one is that Swiber’s capability and outreach is wider than a year ago with more operations in a wider area. The second is that the scope of their operations also widened over a span of a year.


2. Gross profit dropped a little while net margins dropped substantially

The gross and net margins dropped in 2Q, pulling down both in 1H too. I’ve no ready answer, since this is my first analysis of Swiber. Need to dig out more.


3. There is a big jump in liabilities, with total debts to equity ratio almost jumping by 2 times. Current ratio is weaker compared to a year ago. Their cash flow from operations seems to be better. A good part of their cash flow is used on purchase of new PPE. Bonds and new loans raised forms a big chunk of their cash flow.

I read that this is due to Swiber issuing MTN bonds and an increase in bank borrowings. This is to finance fleet expansion and working capital purpose. Indeed, their PPE had increased significantly. There are also 2 vessels under construction.


Outlook

As of 30th June, there is an order book of about USD 664 million compared to less than USD 220 million last year. Contract size is one thing, what are the margins and net profits for these contracts – that’s more important. I’ll be monitoring their margins issues in future results. As usual, no dividends are declared. With a annualized ROE of around 28%, I’d rather they keep the money and re-invest in their business.

Baring unforeseeable circumstances, Swiber is almost certain to have a bountiful year in FY08. I’m actually more interested in knowing what the margins and profit for their deep water drilling operations are, which should be ready by 2010? That will be more exciting and something to watch out for.


Value to price comparison

Based on 1H08 earnings of SGD 10.26 cts, we can annualize it to have a forecasted EPS of 20.5 cts. For a little perspective, the EPS for FY07 is SGD 17.6 only, so let’s put it at SGD 20 cts (that’s a 14% rise in earnings). Last close for Swiber is 1.510 per share, which gives a PE ratio of 7.6 times.

Historical PE

Year-------Price(low)----Price(high)----EPS(SGD)^-----PE(low)-------PE(high)
2006----------0.50-------------1.04------------0.0462---------10.8----------22.5
2007----------0.83-------------3.80-------------0.164----------5.1-----------23.2
2008----------1.51-------------3.60-------------0.200*---------7.5-----------18.0

* forecasted based on 1H08 earnings
^ EPS(SGD) based on Shares investment book, with 1 USD to 1.4 SGD exchange rate

Around $1 per share, Swiber would have a PE of around 5x, which is near to the historical low. That would be such a good margin of safety for a cheapskate like me.

NAV is around SGD 0.70 per share, so at current price, it’s trading at around 2.2x NAV. At $1 per share, that’s 1.5x NAV too.

Sunday, August 10, 2008

Hongguo 2Q results

2Q results

Income statement

1. There is a jump in revenue from 166 mil RMB in 2Q07 to 188 mil RMB in 2Q08, representing a jump of 13.3%. Net profit increased from 26.8 mil RMB to 27.9 mil RMB.

2. Gross profit margin increased from 41.6% to 45.2%. Net profit margins decreased from 16.1% to 14.8% quarter to quarter. I'm currently monitoring net profit margin situation.

3. Selling and distribution/admin expenses(SDA) to revenue (%) increased from 24.5% to 28.0%.

4. Net profit margin drops mostly due to share of losses of JV (580k RMB), finance cost (395k RMB) and a drop in 'other operating income'.

Here's a summary of quarterly ratios:

-------------------------1Q08-------------1Q07--------2Q08----------2Q07
Gross margin--------41.6%-------------39.4%---------45.2%----------41.6%
Net margin----------15.3%-------------16.8%---------14.8%----------16.1%
SDA to revenue------23.1%-------------19.7%---------28.0%----------24.5%


Half year results

No need to talk so much, a table of ratios will do the trick.

-------------------------1H08-------------1H07
Gross margin--------43.3%-------------40.5%
Net margin----------15.1%-------------16.5%
SDA to revenue------25.3%-------------22.0%

As mentioned, I'm a little worried over their net margins. It's to be expected while their new shops are opening and hence net margins continue to fall. As long as it stabilise around 15%, I'll be happy.

1H08 revenue is 412 mil RMB, while 1H07 revenue is 342 mil RMB. For a little perspective, the full FY07 revenue is 739 mil RMB, so the 1H08 revenue is already 56% of last FY's revenue. My full year FY08 revenue of around 890 to 1000 mil RMB is on track. Net earnings of 62 mil RMB for 1H08 also compares well with full year FY07's earnings of 110 mil RMB. Baring unforeseen circumstances, I'm sure Hongguo FY08 results will be better than last financial year.


Balance sheet

-----------------------------1H08------------1H07
Current ratio----------------3.6-------------2.8
Total debt to equity(%)------27.4------------37.1
ROE(%)-----------------------11.7------------11.4%

There's no long term liability. The notes payable to trade creditors are interest-free and secured on fixed deposits, amounting to 16.3 mil RMB in 1H08, compared to 37.8 mil RMB in 1H07. No big changes in balance sheet items for Hongguo. As usual.


Cash flow

Net cash from operating activities for 2Q08 dipped to -12.2 mil RMB, from 14.5 mil RMB 2Q07. Main culprit is the huge amount of notes payable. I think there's nothing alarming about one quarter of negative cash generated from operations, esp when it's used for paying down their notes payable. As mentioned in the balance sheet, the notes payable from their current liabilities dropped by more than 50%. Hongguo is using its cash flow generated from its operations to pay it off.

As for investing activities, there is no disposal of subsidiary for this 2Q, so there is a dip in the net cash from this part of cash flow. Again, nothing important worth mentioning here.


Others

EPS for Hongguo in 1H is $0.1563 RMB. My target for FY08 EPS is $0.32 RMB.

Here's the contribution to revenue and by its different brands

C.Banner --- 62.2%
E.Blan ---- 9.2%
Contract manufacturing --- 17.0%
JUC --- 6.9%
Naturalizer footwear --- 1.7%

Of note is that while all other business, there is an increase in new outlets for 2Q, there is actually a close of 6 retail outlets for Jiangsu Unity Corporation (JUC). This will be something to look out for in their annual report for FY08. Naturalizer footwear also started contributing to their revenue since 1Q08.

Production capacity dedicated to contract manufacturing segment was increased to 6 production lines. The management that they believed this current level of production is adequate in satisfying demand, hence there are no immediate plans to further expand production capacity in short term. This means there are no foreseeable big capex in the near term. Cash flow should further improve.


Value to price comparison

Annualised EPS for FY08 is SGD $0.06252. Last close is SGD $0.33 per share. This represents a PE ratio of 5.3x. This is around historical low PE of Hongguo, which is 5.5x (occurred in 2005 and 2006).

Dividend paid out in FY07 is SGD 1.418 cts per share. At last close of SGD $0.33 per share, it's around 4.3% dividend yield (based on FY07's dividend). Actual amount will vary as it's subjected to the exchange rates of USD because the dividends are actually paid in USD and posted in cheque, instead of the usual direct transfer to bank account. Not that it matters, actually.

Applying Graham's strict (current assets - total liabilties)/shares outstanding, we get SGD $0.192 per share. Using NAV [(total assets - total liabilites)/shares], we get SGD 0.267 per share.

------------------------
Hongguo's 1Q08 result analysis is here.

Tuesday, August 05, 2008

China Hongxing's 2Q report

China Hongxing gave a strong 2QFY08 report. Here's the highlights of the reports:

1. Revenue increased 53.1% for the quarter ending 30 June 08. For the 1HFY08, revenue increased by 48.4% compared to 1HFY07. Gross margin dropped from 42% in 1H07 to 40% in 1H08. For the same period, net margins also dropped from 18.8% to 17.4%.

My take:

The revenue growth of Hongxing is always admirable. They are on the fast track to increase their points of sales (POS) rapidly, and this contributes to their top line exponentially. Just for the first half of FY08, they increased their POS by 397 to 3,648 in China. In the whole of FY07, the revenue is RMB 2,046 million. Just for 1H08, the revenue is already RMB 1,333 million. If we annualised the 1HFY08 revenue figure, we're going to see a 30% increase in revenue from FY07 to FY08. Probably more than this, since 4Q is their strongest in sales for the entire year.

There is strong revenue growth in all segments of their business, something to cheer for. Footwear makes up 68.5% of their revenue, while apparel makes up 26.8% in 1H08, compared to 59.4% of revenue in footwear and 33.2% in apparel for 1H07.

For the margins, there is an appreciably drop in both gross margins and net margins quarter to quarter. In FY07, gross margin and net margin are 41.4% and 20.4% respectively, compared to 1H07's 42% and 17.4%. I think this is normal, as the new POS are just starting up and needed some time to bring in the crowd and add in to the top and bottom line. I think one needs to be more mindful of the expenses chalked up in the meantime - Selling and distribution in 1H08 is now at 257 mil RMB, compared to 312 mil RMB for the whole of FY08. If management carries on the pace of their expansion of new POS, their gross and net margins will definitely be squeezed by higher expenses.

I think I would exercise caution in building the brand empire. Too much too soon will breed redundancy, which will cost them dearly if economic situation isn't as rosy as they forecasted.


I found something ironic in the footnotes of the results. It mentioned on pg 9 of 13 that the strong growth in revenue is mainly attributed to:

"(iii) our ability to raise our selling prices; and"

But a few lines down, under the heading of "Cost of goods sold and gross profit margin", it mentioned that the gross profit margin went down because

"This was mainly due to product discounts of approximately RMB 78.0 million provided to our distributors and retailers".

While this is probably nothing worth alarming over, the ironic of the situation struck me. If they are able to raise their selling prices, why offer discounts to sell to distributors and retailers? Their business strategy?


2. Current ratio for 1H08 is 15.6. Quick ratio is 14.8. For the same period, total liabilities to equity is 13.6%. Cash flow from operation went down to - 248 million RMB in 1H08, compared to 90.8 mil RMB in 1H07.

My take:

Hongxing always had very good gearing and low borrowings. In FY07, current, quick and total liabilities to equity are 14.7, 14.2 and 14.4% respectively. I don't think they have much problems of insolvency in the short term, nor in the long run.

For their cash coming from operation, the huge shortfall should be due to the increase in prepayments, deposits and the receivables - to the tune of 592 mil RMB. There is also a corresponding big increase in the inventories held (which they mentioned is for the commencement of their new manufacturing facilities). I believe this is normal for a company that is on the fast track to increase their POS, so they needed to increase their supplies to facilitate the setting up of these new POS. Indeed, they mentioned this on pg 11 of 13.


3. EPS (diluted) increased from 7.57 cts RMB to 8.61 cts RMB in 1H08. For non diluted basic EPS, it increased from 8.44 cts RMB to 9.14 cts RMB for the same period.

My take:

For FY07, EPS (basic) is 16.4 cts RMB. If we annualised 1H08 EPS, we can roughly get around 18 cts RMB, representing around 10% growth in EPS. At current price of 0.485, this represents a FY07 PE of 14.7x. Forward FY08 PE will be around 14x. While it did come down from a PE of 20x just 3 months ago, I think at least at 14-15x PE, it's a more reasonable price to enter. Reasonable but not necessarily giving a wide margin of safety.

Assuming a pessimistic scenario, I think a growth of 10% EPS is what I can accept. So perhaps a PE of 10x, with a price of around 0.34-0.35 seems to offer more margin for a deeper and better sleep at night.

Monday, August 04, 2008

C&G Industrial holdings

C&G Industrial holdings had a ninja 2QFY08 announcement on 3rd August, yesterday. It is rare to see a company giving its result announcement on Sunday. Caught me off guard, so to speak :) I noticed it when I saw a big drop in % change - around 27% drop - when I checked my watchlist.

Not going to do any detailed analysis. I thought this is a good candidate for pure Graham's play. The big drop is likely due to the bad 2Q08 results. Revenue dropped 7.2% compared to the 2Q07, gross profit dropped 17.4% and net profit dropped 66.5%. What caught my eye is actually the huge administrative expenses chalked up - to the tune of 23.9 million RMB, an increase of 362.4% from 2Q07.


A few factors caused the 2Q08 results to stink:

1. Revenue dropped because sales are affected by snow story in early 2008. But I think the more important fundamental change in their revenue stream is due to the fact that their yarn products are now confined to functional yarn, combed yarn and compact combed yarn. These are products with higher margins and those normal yarn products with lower margins are not longer manufactured or outsourced since Feb 2008. I think this creates a short term drop in revenue, but can potentially bring about greater good in the future.

Selling price were also reduced during 2Q08. This is worth looking closer because if a company had true competitive edge over others, I wouldn't expect selling prices to be cut. Is there a problem with tough competition eroding their selling prices and hence profits?

2. Net margins dropped due to the drop in revenue but no corresponding drop in the cost of sales. From around 19% net margins in 1H07, it dropped to 15% net margins in 1H08 (extraordinary gains are inclusive). 28.8 % gross margin dropped to 27.8% during the same period too.

To me, it's a short term problem. If their plans to manufacture and sell higher margin products succeed, this short term drop in net margins and gross margins will correct itself.

3. Other income - this is due to the exchange rate gains made in 2Q07 to the tune of 4.3 million RMB while there is a exchange rate loss made in 2Q08 around 1 million RMB. Did they do some form of hedging?

4. Administrative expense increases a lot because of an increase in consultancy fee for research and development (14.7 mil RMB). I suppose this is one off and will not recur every quarter. If this 14.7 mil RMB is added to their 1H 08 results, the drop in net profits is only around 8%, and not the 26.6% report in the results.

In other words, this could just be another temporary problem, just like their net margins and possibly revenue drop.


Graham's play?

What is so interesting about C&G is that they are sitting on a huge pile of cash and cash equivalents - 560.873 million RMB. Taking 468,000,000 as the number of shares outstanding, this gives us a cash/cash equivalent per share of 0.234 SGD.

I'm not sure where the cash comes from, but I think it's likely coming from the net proceeds from issue of shares of 218,514 million RMB made in FY07. This amount is just carried over to the current FY.

Let's be really conservative and calculate the total liabilities per share. Total liabilities stand at 228,661 mil RMB, giving us total liabilities per share of 0.098 SGD. Thus, after paying off all liabilities using only their cash/cash equivalents, there is still a cash per share of 0.142 SGD.

Graham recommended using current assets to minus off all liabilities (my calculation is even more conservative since I only used cash/cash equivalents to minus off all liabilities, which is part of current assets). Doing that we have a value of 0.192 SGD per share. Using a margin of safety of 30%, we get around 0.134 SGD per share.

Anyone game to play Graham on this company? :)

--------------------
edited: Mike informed me that I had miscalculated some figures because I used the wrong shares outstanding (I used the 07 figures instead of 08). Re-did my calculations :)

Friday, August 01, 2008

Circular to shareholders

CIRCULAR TO SHAREHOLDERS (“CIRCULAR”)

in relation to

THE PROPOSED UPGRADING OF BASIC CBOX TO PREMIUM CBOX (“THE UPGRADE”)

------------------------------

DEFINITIONS

For the purpose of this Circular, the following definitions apply throughout unless the context otherwise requires or unless otherwise stated.

“BullyTheBear” : The once exclusively technically inclined, but now almost exclusively fundamentally inclined financial website in Singapore

“cbox” : The tiny little community space above the blog posts of BullyTheBear and below the header, where shareholders can type in messages and discuss the mundane and important issues of the day

“Chairman” : Chairman of BullyTheBear website, known popularly as La Papillion, or LP

“Exchange rate” : Exchange rate of 1 USD to 1.40 SGD, taken conservatively.

“Mike” : Chairman of Straits Times Index. Despite everyone calling him Mike, Mike is not his real name. Mikedurst is what he is known in cna forum

“Upgrade” : The changing of the free and basic plan of cbox to the paid and feature-ful premium cbox

-----------------------------

To: The shareholders of BullyTheBear


Dear Sir/Madam

THE PROPOSED UPGRADING OF BASIC CBOX TO PREMIUM CBOX (“THE UPGRADE”)


1. INTRODUCTION


1.1 The Upgrade

The Chairman of BullyTheBear would like the shareholders to consider this proposal of upgrading the basic cbox to premium cbox. The cbox had been an integral and important part of the culture of BullyTheBear. Despite several major facelifting and structural changes that had occurred and will occur in the future, the cbox is one feature that will be set in stone. In fact, BullyTheBear will not be where it is today if not for the bond building and sharing that took place among shareholders, many of whom are regular users of the cbox.

As such, on 1st August 2008, the Chairman decided to act on the suggestion by Mike on the Upgrade.


1.2 Purpose of this Circular

The purpose of this Circular is to provide shareholders with relevant information relating to the Upgrade, and to seek shareholder’s approval and feedback for this exercise. Shareholders are requested to give honest feedback, but it is to be noted that the decision of the Upgrade lies solely on the Chairman. That being said, the voices of the shareholders will taken into consideration on the final deliberation of the Upgrade’s decision.


2 Details of the Upgrade


2.1 Listed below are the features that the Upgrade to premium cbox will bring about:

(a) Higher capacity – the premium cbox can store up to 600 messages (as opposed to only 100 messages for basic cbox) with up to 1000 characters long each. Each and every post are also archived.

(b) Users can delete their own last messages in the event of typos. The administrator can also delete messages and ban users with a single click.

(c) Ad-free

(d) Dynamic auto-refresh – yes, the feature everyone is waiting for. The rate of autorefresh is dynamically adjusted to the rate at which new messages are being posted

(e) Sound notification in the event of new messages. This complements the auto-refresh.

(f) A ‘who’s online’ display lists who is viewing and who is chatting

(g) Advanced style editing

(h) Custom word filter

(i) Allows users to password protect their names to prevent impersonation


2.2 Cost of the Upgrade

Cost of the Upgrade depends on the period of time for which the premium cbox is purchased. Generally, the longer the period, the cheaper the cost is. Here are the costs for different periods:

Period(months)----------Cost(USD)------------Cost per month (USD)
------3------------------------$6.00-----------------------$2.00
------6------------------------$11.00----------------------$1.83
------12----------------------$20.00----------------------$1.67
------24----------------------$35.00-----------------------$1.46


3 Evaluation for the Upgrade

In evaluating the Upgrade, the management of BullyTheBear had taken into account the pertinent factors set out below which will be considered as they are deemed to have significant bearing on the assessment.

(a) Rationale of the Upgrade

(b) Financial effects of the Upgrade

(c) Possible effects of the Upgrade


3.1 Rationale of the Upgrade

As a responsible company, BullyTheBear believes in involving shareholders in its major decisions. While sole responsibility and decision eventually rests on the management, the Chairman still believes in seeking honest and prompt feedback. Below are the key reasons for the Upgrade:

(a) As mentioned in the Circular, BullyTheBear is a shareholder friendly company. There are currently some small amounts of cash and cash equivalents held in the advertising revenue of BullyTheBear account as mentioned the 1HFY08 results announcement dated 4th June, 2008. While small, it is not insignificant. The Chairman wishes to reward shareholders for their continued loyalty to the BullyTheBear. Consider this the dividend for supporting (and continuing to support) BullyTheBear’s only source of revenue.

(b) It is the wish of the Chairman to give back to society what it had been given to him. Through the tiny space occupied by the current cbox, a lot of important discussions had been debated and ideas thrown around shareholders. By the Upgrade, it is hoped that such active discussion will continue to be an active feature of BullyTheBear. The Chairman would like to take this opportunity to once again thank all the regulars and not-so-regulars who frequent the cbox daily like the neighborhood’s kopitiam.

(c) Though this is not a serious and prevalent problems yet, the Upgrade will prevent impersonation of regular users of cbox as the premium version allows the user to password protect their nickname. This protects both the integrity and credibility of users – two of the important tenet that is held closely by BullyTheBear’s management.


3.2 Financial effects of the Upgrade

The cost of the Upgrade will be borne solely by BullyTheBear internal cash/cash equivalents, funded entirely by the advertisement revenue generated while serving the shareholders. There are no plans to issue rights shares or rights warrants to fund this Upgrade. Depending on the period of the Upgrade, this exercise will set BullyTheBear’s account by anything from USD 6 to USD 35 or an equivalent of SGD 8.40 to SGD 49.00 based on the Exchange rate.

Donations are welcomed, of course. For those donors who are afraid of conflict of interest between serving the good of BullyTheBear and the self-serving good of fattening the Chairman’s bank account, there is an option of buying the Upgrade as a gift. More details can be found here.


3.3 Possible effects of the Upgrade

Since the premium cbox will have auto-refresh, the Chairman fears that this might slow down the speed of downloading BullyTheBear’s site contents. Since there is a 30-days money back guarantee, if there is ever a noticeable slowdown in the access speed, the Upgrade will be downgraded as soon as possible.

Other than this, other possible effects could be an increased usage by shareholders and possibly new shareholders. Disruptive personnel with wild rantings of “Go and Die” and spamming of websites can also be controlled more effectively, ensuring a more conducive environment for the benefit of shareholders.


4 Conclusions

The Chairman would like shareholders to give honest and prompt feedback on the Upgrade. Shareholders can do so by clicking the comments button at the end of this Circular and they can be sure that the Chairman will address their concerns and feedback within 1 working day. The Chairman would like to recommend:

(a) Upgrade period of 12 months, with an expense of USD 20.00 or SGD 28.00 based on the Exchange rate

(b) request active shareholders to visit the cbox website for more information, though most of the key information had been listed in this Circular.

Wednesday, July 30, 2008

Feeble defense of Hongcheng

What an interesting forum!

Someone launching attack on FA people on huatopedia. Basically, millionairemind is trying to question an assumption held by some- that there is a PE where the stock will not go any lower. The thread is about busting common investing myths - excellent discussion going on there :)

He argued that,

"If a stock you are looking at has a PE ratio of 6 and growing at a reasonable 10-15% a year, with low debts, would you buy it??? Sure, most FA will say... Remember, the value of a company is what the market prices it at...

If you have bought it at a PE ratio of 6 around 50cts... you would have lost 60% OF YOURE INVESTMENTS BY NOW!!! Would you buy more at say 50cts?? How about 40cts?? 30cts??? It is now 20cts and change. It has a PE ratio of around 3 now. And the SAD news is that this is NOT A MONEY LOSING COMPANY!

The 9months earnings so far is up about 25% YOY. The earnings is of course decelerating but not the company is not making a loss... that is what I mean by the market always knows better and without institutional support, the stock will not move."

------------------------------

Well...let me try to piece up a feeble defence. I have no presumption that I know anything. But firstly, I don't buy just based on PE. In fact, PE is just one of the way I used to calculate the rough range in which the stock will trade. It will never be a valid reason to buy just based entirely on PE. To me, it's a little over-rated. Secondly, it just got IPO-ed on 8th August 2007, meaning that it's just slightly short of 1 year. I personally won't buy IPO stocks (because no matter how much I tikam, I always didn't get any lots!) because the results could be adjusted to 'prepare' for the IPO. I prefer to have it for 5 years at least to have a feel of the company's business before even entering it.

I tried to search for China Hongcheng results - they only have from FY06 to FY07, and 1st to 3rd quarter FY08. Let me ignore quarterly results for now.


I hate doing companies with very short history. Since FY06 is pre-IPO, we mustn't treat it too seriously - this means only one year worth of data.

At first glance, seems like this company's business is doing well. With a gross margin of around 29% and a net margin of 16-17%, it seems rather profitable. ROE of 50%, that's very very high. Let's break down ROE of into 3 components:

1. Financial leverage : Total assets/Total equities

2. Asset turnover: Total revenue/Total assets

3. Net margin: Net profit/Total revenue

ROE = Financial leverage x asset turnover x net margins

Yr---------Financial leverage-------Asset turnover-------Net margins---------ROE
FY07------------4.56--------------------0.70---------------16.7%------------53.3%
FY06------------6.78--------------------0.64---------------12.8%------------55.4%

Seems like the reason for their high ROE is from their leveraged structure. Indeed, looking at the current and quick ratio suggest a rather low figure. Total debts to equity paints an even worse picture. If I'm interested in the company, I would do a comp study on other similar companies. Take note that the below comp table is lifted from their presentation slides, dated Oct, 2007. I wonder what the PE of the comparable companies will be like now. Perhaps it will show that Hongcheng at PE of 6x or even current PE of 3x isn't that fantastic.


We can see that the ROE of china hongcheng is one of the highest. But we must break up the ROE to see if the ROE is boosted by high borrowings or not.

Below is the price to EPS (SGD) for China hongcheng,

Year------price(high)----price(lowest)----EPS---------PE(high)-------PE(low)
2008-------0.35-----------0.185--
2007-------0.58-----------0.33----------$0.066---------8.8------------5.0

* note that highest and lowest price is the closing price, not the intraday high or low
** EPS is in SGD

Data of historical PE is too little to be of much use - that's one of the reason why I won't buy IPO stocks with less than 5 years of history behind them.

One thing that screams loudly as I was browsing through is the fact that around 70% of their revenue comes from overseas in FY07 and of that amount, 42.4% comes from US. That's like 30% of their revenues from from US. I'm wondering if their business will be affected adversely should US suffers a slowdown or recession in their economy. Hmm, food for thought.

Of their business, their should start to increase selling more bed linens. My goodness, those have a gross margin of 41%, but takes up only 8.3% of revenue. Most of the product revenue comes from selling grey and dyed cotton fabrics (53.8% of revenue), which earns a gross margin of 21%. Didn't know bed linens can earn so much :)

I guess that's my feeble defense. I don't even think it's a defense, haha, I'm just thinking out loud on this company. I anyhow anyhow did some valuation, using 10 yrs with no terminal value, discount rate of 8% and EPS growth of just 10% (it's around 20%) - I get around $0.80 per share. Seems like good value at current price of $0.20 - I'll likely get like 15% returns in 10 yrs. But this company is too young to be sure. As long as the EPS grows up by than 10%, I think roughly roughly lah.

Don't hurt me too badly, millionairemind :)

Monday, July 28, 2008

Firsts

This weekend had been a fun one for me :)

For the first time in my life, I ate durians! I even sent a mass email to my best buddies, asking them if they wanted to see me eat durians for the first time. My maiden voyage, so to speak. Well, don't ask me why I didn't eat durians before. I seriously don't mind the smell (it's quite nice-smelling) but I just didn't eat it before today.

Perhaps I've been passing by some durian stalls on my way to work. Perhaps it's the durian seasons. Perhaps I've seen those pictures of these spiky crowns of the king of fruits posted on huatopedia that got me interested in trying.

No, not this 'durian':


It's this one:


I've also tried eating mangosteens for the first time in my life! Swa-ku hor? I find durians manageable. I don't like it and don't mind eat it. But after eating a total of 5 seeds for the past 2 days, I think I've got enough durian poisoning in me to last me 1 full year! Someone suggested to me durian puffs, which is nicer and not so strong compared to durians. Perhaps next time?


Mangosteens, on the other hand, taste much nicer. A little like oranges, with a sour-ry after taste. I love it! My gf even taught me how to 'open' a mangosteen :) Eating the king of fruits and the queen of fruits together makes the king a little easier to manage :)

This year marks many firsts for me:

1. First time I tracked my personal income and expenses in detail

2. First time I switched my diet to mainly vegetarian

3. First time I'm the only one requesting for vegetarian course for wedding dinner. My portions will be served separately - it's really cool, everyone should try it once!

4. First time I ate durians

5. First time I ate mangosteens

6. First time I read so many books!!

When is the last time you did something for the first time?

Friday, July 25, 2008

Osim 2Q and SMRT 1Q

Seems like earnings seasons are coming, this means that I have a lot more to do analysing and musing over their results. I'm looking for signs of a general global slowdown due to the subprime fallout (if any). So I'll be looking briefly at results of companies which are of interest to me.

1. Osim announced their 2Q08 results.

My take:

Still losing money but compared to 1Q08, they improved noticeably, with the EPS going from -2.4 cts in 1Q to -1.1 cts in 2Q. To be fair their operating profit margins improved quarter to quarter, from 2.2% in 1Q to 5.3% in 2Q - still too low for my comfort level. Hello, you are selling luxury products, if your margins so low, how to sustain it when the going gets tough? Too many competitors in the industry all taking a chunk of your profits? Don't bullshit me about population getting older so need more health massage chairs - when there is no money to eat, the last thing anyone will buy is a massage chair.

They also mentioned that for brookstone, their ill-fated investment in US, had their closest competitor exiting the business. Must be damn bad, that's my first thoughts. Overall revenue is marginally better, improving from SGD115.6 million in 1Q to SGD115.9 million in 2Q. Brush up your act, Osim, show us a good turnaround story that will get investor rooting for you!

2. SMRT 1Q results

My take:

Revenue increased by 11.2% comparing 1Q08 to 1Q09. Must be the stupid gantries improving their business, I guess. However, total operating expense increased 13.1% too. This must be due to the combined forces of higher energy cost and higher number of train rides. They increased their peak hour train rides to satisfy their customers, after years of ignoring their pleas for more trains. As a result, their profit after tax increased 6.2% - bad at all.

Segment wise, I think their MRT business is still doing pretty well, despite the higher operating cost. They mentioned that if oil prices persist at high levels, their bus business (the old TIBS renamed as SMRT buses) will be affected. I agree. Buses are more affected by energy cost than trains, but trains have initially higher capex cost.

Interesting company...something that we as investors can always feel the pulse of the business since it's so directly affecting us. Very good cash flows. Total debt to equity of around 1.05, but current ratio of 1.7 - given their strong cash flows and stable, recession proof business, it's very okay. Want to beat the fare hikes? Buy their shares and get cash rebates off the dividends given.

Wednesday, July 23, 2008

New news

Hmm, I realised it's been such a long while since I commented on the market or the announcement which I read daily from sgx website. I haven't commented on such things since I stopped blogging daily. Hoho, to think that I once used to blog daily...where got time now? :)

Today, several news caught my eyes as I was roaming through the announcement website.

1. Singtel announces the first-in-the-world landmark deal with major US studios, Disney ABC International TV, 20th century fox and Warner Bros International TV, which enables Singtel to screen over 50 top US tv series as early as 24 hrs after their US premiere for its mio TV service. Thus, Singtel became the first Internet protocol TV operator in the world to offer a model.

My take:

Well, I don't watch tv at all. The last tv series I watch is maybe 6-8 yrs ago? I have no idea how people are addicted to tv shows. In either case, there are so many free shows in the internet, so I'm wondering why people even want to pay. Either case, it sounds pretty important for Singtel's fight over cable tv with Starhub.

2. Ecowise is going to give a special interim dividend cash dividend of $0.01 per ordinary share for the financial year ending 31st Oct, 2008. At the same time, they are proposing a rights issue of 214,165,181 new shares at an issue price of $0.01 for each proposed right shares, on the basis of 1 rights share for every 2 shares held, disregarding fractional entitlements.

My take:

Hmm, didn't Ecowise did such a thing not too long ago? Digging out the old archives, I found that on 24-Jul-2007, they did put an announcement to propose a cash dividend and rights cum warrants issue. Back then, the special interim tax exempt cash dividend for the financial year ending 31st Oct, 2007, is $0.03 net per ordinary share. They also proposed a rights issue of 249,975,000 new shares at an issue price of $0.01 per rights share with detachable free warrants. Each warrant carries the right to subscribe for 1 new share at an exercise price of $0.05. So back then, every 1 share held entitles the holder to 3 rights share and 1 warrant. Complicated? Yes, I thought so too.

Oh, so now, after nearly 1 year, they wanted to give out another 'special' interim dividend, coupled with rights shares but no warrants. It's not so 'special' if they did it for two successive years!

This is seriously going to dampen their share price in the short term. But it begets a more serious question - what do they need the new capital for? Are they concerned about existing shareholders by diluting their share holdings again and again? Take a look below:

Based on today (date of announcement):
Share capital: 376,067,246
Outstanding warrants: 52,263,116
Potential rights issue: 249,975,000

This can seriously affect EPS, considering the huge dilutive effect of the rights issue. It's going to nearly half the EPS ... goodness.

3. Yellow pages announces initiatives to drive revenue growth - it plans to partner government agencies and related organisations to launch new products and services. Value added services for SME customers to target niche groups via print and online platforms are also planned

My take:

Sigh...I was once into Yellow pages for quite some time. I bought at $1.670 on 3rd April, 2006 (luckily only 1 lot!!). It's now $0.675 now, tsk tsk tsk...

I sympathize with them. The real society had moved its searching online and it's only recently that Yellow pages poured more money in IYP (Internet yellow page). There are lower sales contract value compared to last year (a drop of 3.1%) but they consoled themselves that their average revenue per advertiser increase by 4.3%, even as the number of advertising accounts declined 7.8%. They are operating in a competitive environment, and I think nothing of their branding, which they think it's an intangible asset. Seriously, when is the last time anyone flipped the yellow pages to look for stuff? I think greenbook seems more commonplace than yellow pages.

This statement sounds quite funny:

"Backed by the Group's core assets: a proprietary comprehensive database and the established Yellow Pages brand name, we believe the Group is poised for growth, as illustrated by the pages intentionally left blank to accommodate our growth in our FY2007 Annual report"

That was said by Mr Chow, CEO of Yellow pages. I even went to search for their annual report and viola!


Pages 124 (of 148) to 146 are 'left blank intentionally to accommodate our growth'. A total of 23 pages are left intentionally blank. The total number of pages for the statements, inclusive of notes to financial statements, took up over 50 pages only. It seems that there are PLENTY to grow for yellow pages with 23 pages are left blank for that. Lame lame lame...

Tuesday, July 22, 2008

Liar's Poker and Confessions of a Wall street analyst

A few weeks ago, I was browsing books in the library as usual when two books caught my eyes – Liar’s Poker by Michael Lewis and Confessions of a Wall street analyst by Dan Reingold. I thought it was good fortune that had me borrow both books at the same time, because reading these books one after another brought me to a level of insight that reading them individually would not bring.


Liar’s Poker is the more famous of the two. It talks about the story of a trader and bondsman who went through hell and came back ahead, dealing and wheeling in the pits of Salomon Brothers. I learnt more about the history of Salomon Brothers in this autobiography than I would have had I read it straight from a point by point, chronologically arranged sequence of events. It’s the story that stays after the facts faded from memory and the author weaves the story so tight and so engaging that it’s literally a page turner for me. Imagine this – a page turner for this genre of books!

It struck me that back in 1980s, these traders and bond salesman are paid to take enormous amount of risk, all backed by their clients’ money. The firm actually encouraged them to take such risk. A few hundred millions is small change for these people. It’s incredible to think that this insane amount of money just floats around waiting for Big Swinging Dicks to play around.

The other book, Confessions of Wall street analyst, is a little more dry. It had to be, it’s about the life of a idealist analyst who wants to go into wall street to espouse his independent views, but left the street a cynic wary of the independence of American’s financial system. The book is full of examples where investment bankers, analyst and issuers had major conflicts of interest, back in those days when SEC haven’t clamped down on them. It was in the heydays of the telecoms M&A era and subsequent internet dot.com bubble. I had first hand account of how Worldcom blew up, catching analyst and even insiders wondering why nobody found out the glaring aggressive accounting in their books.


I read about ‘swapping’ – where company A bought products from company B and vice versa, resulting in both companies booking a huge increase in revenue and not necessarily an increase in earnings. They did this to justify their huge PE ratios attributed to them and the target revenue and growth set up management. It was an incredible insight into the pitfalls of seeking growth at all expense and the eventual and inevitable exposure of such growth. The scary part is – even insiders do not know about it. Insiders like CEO or CFO, so absorbed in their own story of growth through acquisition and glowing from their soaring share prices, actually believed it will last forever.

I already had the idea that analyst are not entirely independent because they are paid by the company that usually also had a brokerage and investment banking wing, which is a huge source of potential conflicts of interest. But reading these two books bought it to a huge new level of belief!

Perhaps the last few words in the Confessions of a Wall street analyst will cement the ideas in my head forever:

Of all the lessons I’ve learned in my time on the Street, the most difficult one to swallow is that I no longer believe in the transparency of the American financial system. When I came to the Street, I saw it as a place where there were plenty of sharks, but also a place where American capitalism reigned supreme, a place where everyone had a chance to do if they were smart, hardworking, and a little bit lucky. It was a game I enjoyed playing – at least until I realized how corrupted the game had become.

Sunday, July 20, 2008

Dark Knight Review

I must say that Heath Ledger’s passing left a void in the art of villainy that will not be filled for a long time. His masterful portrayal of Joker, the arch-nemesis of Batman, surpasses the good work done by Jack Nicholson in Tim Burton’s Batman, I dare say. While Jack Nicholson’s Joker is more campy (which is untypical of Tim Burton’s movie), Heath Ledger’s Joker is the pure, psychotic and maniacal force that can stand by its own in the movie.


I think the director’s understanding of the Joker is immense and accurate. The Joker works not for money but understands the usefulness of it. His purpose and reason for crime is to ‘play’ with Batman, to challenge him. As a parody of Jerry Maquire’s famous (perhaps infamous) line, “You complete me”, the Joker acts as the star-crossed lover of Batman. Joker’s ‘love’ of Batman is the hatred of him, yet Joker will not kill Batman because without the challenge that Batman poses to him, he will have nothing to live for. At the same time, no matter how much hatred Batman had for Joker, he will not kill Joker because otherwise all that Batman fought for will be for nought. A love-hate relationship thus plays out nicely in the movie. Another thing worth mentioning is the social experiments that Joker tries out in the movie. A true student of game theory by John Nash, he plays out big scale human experiment, pushing the frontier of experimentation beyond ethical limits. The Joker had such a masterful understanding of the human psyche that he manipulates and twists to create another villain in the same movie.

A pity that Heath Ledger will not return to play the Joker again – perhaps it’s for the best, for he left at the peak of his performance and all shall remember him for this last superb portrayal of Batman’s greatest enemy. I really love the body language he poured into the characterization of Joker, especially the scene after he bombed the hospitals and was walking out in a nurse’s uniform. His awkward, slightly stooped, almost resigned manner speaks much more than words can do.

The movie also plays on this major theme of Batman – his fear that what he does every night will turn him into the very people that he fought for in the first place. For the first time since watching Batman movies, I saw consequences in Batman’s nightly adventure in the streets of Gotham city. Self serving vigilantes appear, bearing the mask of Batman but without his philosophy. My girlfriend asked me how do I know which is the real Batman and I replied – Batman do not use firearms. His parents are killed by firearms and he will not use it to fight crime, hence his preference for fist fights and ninja-like weapons. The movie also plays out the Batman as the dark lonely fighter, who can never be the same again after donning the suit. What kind of person can lead dual lives – acting as a rich businessman in the day and a dark vigilante in the night? Perhaps only a psychopath can. Batman is driven by revenge for his parents but at what cost? This a good theme to explore in future Batman movies.

Someone mentioned that this Batman movie lacks weaponry. I do agree. Batman’s greatest weapon– his superb detective mind – is not portrayed in the movie. What I see here is his internal conflict of breaking the law to catch criminals who broke the law. There can be much more time allocated to showcase Batman’s Shylock Holmes-like mind in solving crime, rather than fighting crime. I really love Batman because he is about the only superhero whose superpowers are not superhuman. His superpowers is his very human but excellent mind (ahem, though his status as a billionaire and thus the moo lah acts as the icing to the cake).

My girlfriend commented that the show is a little boring in the first half and gets better towards the end. I disagree. How would the siege of Helm’s deep by Saruman’s Uruk-hai be without the events and circumstances that lead to it? In my opinion, the control of the pacing and tension are done nicely by the director.

Watch this movie. If not for Batman, at least for Joker.

Ps: As a side note, I half expected Peter Parker to leap out to punch Bruce Wayne/Harvey Dent for stealing his ‘Mary Jane’ :)

Thursday, July 17, 2008

China milk's annual report

Had a pleasant surprise when I opened my mail box today - China milk's annual report was out :) It felt surprising 'hard' and when I tore open the envelope, I realised that it's hardcover with metal bindings - something like those lecture notes we had back in school days, except that this is super colourful.


Like a child who had accidentally wondered into the toy department of a shopping mall, I was bridled with excitement as I flipped through the colourful pages. You really had to admit that, hey, this is one of the most interesting (not to mention, expensive) annual report there is! On the front is a hard cover picture of their mascot, named Mo Li (yes, they even have a mascot, with a name!).

Mo Li was hidden behind one of the pages opposite a house. As I flipped the page....


Mo Li jumps out literally as a pop out! She held a china flag which, under the force of the turning page, swings over to the other page. So besides the classic page-powered pop out, there is also a swinging leveraged pop out (ahem, the author is an admirer of pop outs, having made a couple himself, so pardon his excitement as the heart popped out when reading an otherwise boring and plain annual report).


Mo Li promptly introduces her other pals from Australia - Mathilda - who then proceeds to tell us about their breed. The whole thing reads like a story book with lots of pictures. If China milk's intention is to spend a little more money to entice shareholders to read up their business in the annual report, I must say they have succeeded wildly :)

I'll give my thoughts on the numbers in due time.

Tuesday, July 15, 2008

HSBC - good value?

Just came back from a tiring but fulfilling 2 day event - helping a good friend to organise his wedding. I was aware that indymac had fallen and had been rescued. Fannie Mae and Freddie Mac are also in big trouble over the subprime issues. Today, when I finally stared at my watchlist (my companies didn't fall much), I was surprised to see HK falling over 3-4%. Now that is drastic!

Was thinking of whether to add in more HSBC at the current price of 113+-.

Here's what I gathered so far:


* EPS, dividends and NAV are given in USD


* Earnings in reports are given in USD. I used the conversion rate as advised in the hsbc official website (the dividend section) to convert earnings from USD to HKD. Closing price is the adjusted close provided by yahoo! finance site.


At HKD 113 now, the valution for hsbc looks really good. PE (last year's earnings) of 8.9x, which is way below the usual PE of hsbc (around 12x). Dividend yield (last year's dividend) is around 6%++. Given a 12.6% CAGR of dividend for a time frame of 10 yrs, buying at this price will 'lock' the dividends at 6%+ and growing at a conservative 10% per year thereafter. I believe this dividend is backed by a stable 10 yrs track record of increasing dividend.

Based on 2007's dividend,

To get a dividend yield of 7%, the price to buy in is around HKD 100
To get a dividend yield of 8%, the price to buy is around HKD 85

Based on 2008's forecasted dividend of HKD 7.71 per share (assuming 10% increment from 07's dividend),

To get a dividend yield of 7%, the price to buy in is around HKD 110
To get a dividend yield of 8%, the price to buy is around HKD 95

Will do more in future post.

Thursday, July 10, 2008

Into the pits of Mt.Doom, I threw Yongnam

I sold off Yongnam shares yesterday, taking advantage of the 152 pt rise in DJ the night before to dump out all my holdings. I'm still holding Yongnam warrants still though. Those are really low cost and can be converted to yongnam should the situation becomes more favourable in the future. I'll take my time on those.


Irrational story

I woke up in the morning, feeling that I seriously need to trim the weeds of my investment garden. I've always been toying around the idea that I have to throw off yongnam since I bought at such a high price. Nothing moves it anymore and I realise construction isn't what I would like to have in the long run. Price had been moving downwards, but within range of 0.165 to 0.150.

I ran through the annual report 2007, worked out a few ratios and convinced myself that I am going to sell it at 0.160. I keyed in my orders to sell at buy price, as I do not want to wait anymore, lest I have seller's remorse and withdrew my order. Besides, the volume of the sell queue is quite huge and the volume of buy queue is low. I can't afford to wait as I'm afraid there will be a sudden sell down to push the price down 1 bid. Might as well sell it straight at buy price.

Once I sold it, I felt relieved. Finally threw my 'one ring' into the pits of Mount Doom, into the fires of Mordor!


Rational story

I bought Yongnam in two tranches - one is at 0.345 and another at 0.435, giving me an average buy in price of 0.390. It was April 2007 then, and I do not know what is the use of looking at earnings. Had I looked at it then, I would have realised that the PE at the time of purchase is 54x - I'm too optimistic about the future of yongnam!

PE (based on my average price of 0.390 and 2007's earnings) = 18x
PE (based on my average price of 0.390 and 2006's earnings) = 54x

Yongnam does not have a good consistent track record of earnings. While turnover keeps increasing since 2003, earnings after tax goes up and down. I suppose 2007 is one of their best years to date since 2003.

--------------------------2007---------------2006
Net margins-------------14.1%----------------3.5%
Gross margins-----------17.6%----------------15.0%
EPS (diluted)------------$0.0203-----------$0.0072
Current ratio-------------2.3------------------0.90
Total debt/equity--------1.46-----------------19.2
Trade debtors/revenue--11.5%-----------------5.6%

Their current ratio improved tremendously because suddenly they have a healthy cash balance. A closer look at the cash flow statement reveals where the bulk of the cash comes from. Net cash from operations is -46 million, net cash from investing is -18 million and net cash from financing is +100 million. Thus, because of their big borrowings (90 million borrowings, 10 million from warrants issuance, 63 million from ordinary shares issuance), they manage to get a huge cash balance which boosted their current assets. Trade debtors seem to be worser off than 2006. Judging from their cash from operations, they did seem to have some trouble collecting their debts (85% had passed the due date by 90 days in 2007, compared to 10% in 2006 )

The issuance of shares and warrants increase their share capital base greatly, so their total debt/equity seems lower. In absolute amount, 2006's long term borrowings is 43 mil and 2007's long term borrowings is 75 million. I am very afraid. It's a capital intensive business, cyclical in nature, full of rotten debts and is peaking or had peaked. Worse of all, I bought at 54x PE back in 2007. Can the earnings grow 54%?

I don't know and I'm not willing to bet on it.

As such, I cut it and suffered a loss of 60.24% - one of the heaviest hit, percentage wise.

Tuesday, July 08, 2008

Personal finance

On the advice of HH, I had started on this detailed tracking of my expenses and cash inflow at the start of this year. At first, the process seems very 'xiong', because everytime I spent a cent (including buying drinks/food and snacks), I'll record it on my handphone. Towards the end of the day, I'll record it on my excel spreadsheet. The spreadsheet have all the details broken down into food items, transportation, entertainment, bills, clothings and so on.

The idea here is to figure out where am I in this struggle to reach financial independence. If I do not know how much I spent nor how much I earned, it's hard to figure out where I stand. Most people (including me, in the past) will use a sort of mental accounting, like I spend roughly $5 on food everyday, or I spend roughly $80 per month on transport etc etc. After tracking my expenses for close to 7 months now, I have an excellent idea on what my spending patterns and percentages are.

Didn't some wise person say: What you track, you'll improve? Yes, I agree fully. There's even a graph showing how much I spend vs how much I earn for the months I tracked so far.


Whenever I see that the blue graph is catching up on the red graph, I'll work harder to increase my cash flow in and to decrease my cash flow out. I think it works nicely so far.

I've been tracking my total portfolio too. Total portfolio is what I define as the summation of all the money in my bank accounts, Poems MMF, SG stocks (at market value), HK stocks (at market value), Insurance (inclusive of bonus declared) and CPF. The only item I did not include is the money in my wallet and the coins in my coin pouch.


It's rather satisfying to see that, like the graph above, my 'coins' are stacking up slowly but steadily. Perhaps, like what many had shared with me, that upon marriage, my coin stack will drop one time and upon having a family with children, my coin stack will drop another time.

A few things came out of this exercise:

1. I knew how much my spending is, without resorting to agaration and guesswork. I even even how many % of my money is spent, itemised.

2. For the first time, I am no longer so hazy about my net worth in monetary sense. It gives a superb sense of satisfaction, knowing that I had accumulated a certain amount of money after working hard for this long. I said that because I know many friends who did not know their net worth. Most did not have healthy savings despite working for so long. My take is, if you do not know where you stand now, you do not know how much more to go.

3. This observation is quite a surprise for me. As I had to tally up my books for recording at the end of each month, there is a pressure to try to raise my cash inflow and lower my cash expenses to make the books look good. For example, I can kid myself that I'm spending less this month by doing somethings to push the actual spending till next month.

Suddenly, it came upon me that perhaps, that's what companies do too. They have to report every quarterly, so it's all too human to jiggle their books a little to make it look nicer, like what I do. Knowing this, I no longer treat quarterly earnings as sacred. Not even annual results in fact. Perhaps that is what old ben is trying to say - look at the earnings over a long period of time, not in one year and certainly not in 3 months.

4. This method of tracking expenses is insane. I realised that. It's painful and not many had the discipline to do it too. Even my financial advisor is surprised that out of many people he met, I'm the only one who tracked my finances like that.

Friday, July 04, 2008

Tuition nation

Recently (okay, not so recent), there is an article on straits times regarding the tuition nation. It's here, for those who wants to read it.

The article talks about Singapore having such a high tuition penetration rate, that for every 100 students, there are 97 students have tuition. Ignoring all the sampling biasness and sampling method, it's a whopping 97% tuition penetration rate. This phenomena is exacerbated by the fact that many of these students have multiple tuition, so in fact, we're looking at a penetration rate of more than 100% (if say, each student takes more than 1 subject for tuition).

Why had we come to this stage? I do not wish to comment on it in this posting.

Here, I just want to talk about the ironies of tuition/education/school.

1. Ex or current teachers are the preferred choice for parents when choosing tutors. These are highly paid, perhaps to the tune of twice the normal rate (I'm talking about $80 to $150 per hour). Students are sent to schools to be taught by MOE trained teachers. They didn't perform well enough, so they were sent to tutors who are preferably MOE ex or current teachers. If school teachers can't help them, will these teachers-cum-tutors help?

2. Classes in school have class size of around 30-40, with the norm being 40. Some of the tuition group classes I knew have class size close to 30. Yes, it's cheaper than private tuition (can be half the price of private 1-1 tuition). School is cheap too - that's why the class size swells up so much. Thus, the poor students go from one formal school to another informal school. Does it help?

3. Elite schools draw in the best students. They get the best results, which attracts the best students in. Chicken and egg problem? Which comes first - good schools or good students?

4. Elite schools with specialised programs (IB/IP) have teachers who think like this - students are so smart, I'll just give them worksheets and let them learn themselves. School fees range from a few hundred, easily a few multiples of government schools. Almost all of them have tuition because (I dare say) the teachers can't teach. Many parents have told me about that many of their kid's classmates are have tuition, and learn way in advance of school. In fact, teachers expected their kids to have tuition to 'supplement' school work.

5. Parents select their tutors based on their academic results. I'm guilty of being positively discriminated because of it. Does having good results mean that they can teach well? No, of course not. But most people think so. Perhaps lacking any other way of selecting good tutors, parents go for the overall packaging, much like people will buy a brand of salt because it looks more attractive. Academically good tutors, naturally self-motivated, might not have a way of dealing with unmotivated students because they might find it hard to understand why a student isn't motivated.

Can I offer a better way to select tutors? Yes.

Look for those who failed miserably and managed to stand up and high and tall in the academic world. Look for those whom teachers branded as failures yet return to the teaching force to save more students. Look for those nameless applicants who wanted to go into MOE to teach but their results are not good enough to even be called up for interview. If they don't mind their poor grades, why should MOE mind?

In the end, all I've mentioned here will still not be followed. That's why I still have a job.

Many students asked me why I do not want to join the school. I think I'll be kicked out in 1 month. I'm a maverick in this education business. I can't stand wearing uncomfortable office wear, don't mind student having long, dyed hair, don't mind students using handphone, don't mind them eating in class, don't mind them being so formal and afraid to ask what's truly on their mind. Exams to me are nonsense, I will give students the topics for the coming exams, rather than play hide-and-seek. I don't require strict discipline and I'm do not require their utmost respect. I earn my respect.

Why do I do that? I believe that people learn in a relaxed environment. There are passive inattention and active inattention. The former is what happens when a student stares at you, keeping quiet, but the mind wanders off. The later are those that are openly defiant. Most tend to control the latter, not the former. A little chaos can create the right mix of factors in a genuine learning environment.

Schools cannot tolerate me, so I cannot tolerate the school.

Living life in an uncertain world

There seem to be a healthy discussion about the recent book review which I did, ‘The Black Swan’ by Nassim Nicolas Taleb. I crossed swords with Kennynah on Huatopedia regarding the applicability of normal distribution on everyday occurrences. The comments I received for the review is also very encouraging for me. All in all, a great experience!

I promised durio I’ll share the practicality of the things I’ve learnt from the book. I’ll try to put most of the practical advice towards investing and finance, but I stressed that the advice is equally applicable for the broader aspects of life. After all, life is much more than just the financial aspects.

1. Make a distinction between positive black swans and negative black swans. Black swans events can benefit or cripple. Once identified, expose yourself maximally from positive black swans, and limit exposure to negative ones

There are some situations where you do not want black swan events to happen, as it will cripple you. There are others where you sit around, waiting for black swans to happen, as the benefits are worth all the waiting.

For instance, networking is one thing that benefits from positive black swans. You never know (and can never expect) that the least likely person is the one who will pass you the contacts that will benefit you the greatest. Since there is no significant negative effect for not making the right contacts, one should expose oneself maximally to meeting different kinds of people.

In investing, we all try our best to be minimally exposed to negative black swans. Even though we’re ‘very sure’ of the prospects of a company, do not invest a substantial portion of your capital in. If we do that, we’re really hoping that the negative black swan events do not happen. Hence, there are many methods to reduce the consequences (but not the probability) of such events, such as strict cut-loss discipline, margin of safety, fundamental analysis etc. Different methods, but same underlying principle of preventing catastrophic losses.

In my tuition business, I’ll try to expose myself maximally to all different kinds of students. I’ll never know which student will be the one that will jump from F9 grade to A1 grade, and thus pass all the positive word-of-mouth advertising to potential future students. Downside (where student gets catastrophic results of A1 to F9 type) is actually minimized. How? That’s my little secret.

2. Invest in preparedness, not in prediction

I find the value investing philosophy ties in greatly in this. Didn’t the great gurus of the financial market say about gearing one’s portfolio towards bear market, not bull market? By thinking about the pessimistic scenario, one can avoid chasing the price but one’s capital is protected. Trading philosophy also mentioned about protecting the downside, and the upside will take care of itself.

3. Seize any opportunity, even those that looks like opportunity. This is the same as exposing one to positive black swans. Work hard, not in grunt work, but in maximizing one’s exposure to opportunities.

This is the same thing as point no.1 – exposing oneself maximally to positive black swan and minimally to negative ones. Perhaps here, I’ll mention one more example.

I’ve received very positive feedback that I’m a good writer and reviewer. It’s all very flattering until one looks at the ‘silent evidence’. I’ve written nearly 600 posts in this blog, perhaps only 10 such posts have very positive comments. Thinking in such a way, first of all, humbles me. But the point I’m making here is this: write more, you’ll hit one good article that everyone loves (and everyone remembers). If other articles are not as good, at most there are no comments, thus no significant negative consequences.

What should one do given such outcomes? Expose oneself maximally to opportunities where others can love your work – write more. I’m not saying skills are unimportant, I’m saying that skills are not the ultimate leverage in one’s success.

4. When caught between unknown probabilities of choices presented to you, focus on the (known) consequences of each choice and not on the probabilities. It’s also known as Pascal’s Wager.

Pascal’s wager is actually a debate on whether God exists. The consequences of not believing in God’s existence when there is actually God are much more severe than the consequences of believing in God’s existence when there is actually no God. The probability is incalculable and unknown; one should focus on the consequences of one’s choices, rather than the chances of the choices happening.

That is why one should cater one’s portfolio for the bear market, not for the bull market. The consequences of having big losses when one’s portfolio is too ‘optimistic’ are more severe than the consequences of not making big money when one’s portfolio is too ‘pessimistic’. Assuming one cannot tell the probabilities, the consequences matter more.

When one is stricken down by diseases that cannot be cured by western medicine, should one try alternatives methods? The consequence of not trying the alternative method when it does in fact work is more severe than the consequence of trying the alternative method when it does not work. The worse that can happen when one tries alternative method is that nothing happens.

Here’s a few lessons I learnt from the book:

1. Do not have a reductionist mindset, or what the author calls ‘Platonicity’.

2. Think about the silent evidence – evidence that show the contrary but are not widely publicized

3. Expose oneself maximally to positive black swans and minimally to negative ones

4. When presented with unknown probabilities of choices, focus on the consequences of each choice

5. Do not be quick to judge. Treat empirical data as it is and do not theorize too much. Be skeptical

6. Most importantly, be open minded

Tuesday, July 01, 2008

The Black Swan – Nassim Nicolas Taleb

I have fond memories of this author – one of my favourites among the books I’ve read. I was hooked by his style of skeptical empiricism when I was introduced to his first book – ‘Fooled by Randomness’ – by serendipity. The author will be glad that it is through a series of black swan event that lead me to his first book, and consequently, to his second book.


Long time ago, my gf went to US for a conference on a paper she submitted. Man, in these conferences, there are people literally giving out books for free (to be fair, they did try to sell during the first few days of the conference, but towards the last day, book hell went loose). My gf, a typical free-must-grab Singaporean, grabbed a few of the books, regardless of race, language or religion (ok, I exaggerate). Among the horde of books, one of them is Nassim Nicolas Taleb’s ’Fooled by randomness’.

Talk about Black swan events (these are incalculable, low probabilistic and highly consequential events), my introduction to the author’s first book must fall squarely into such category. The author’s style is very refreshing, a logical salad mixed with lots of stories woven with facts, creating a potent mix of philosophical brouhaha.

Black swans are named as such because of this story. Imagine all throughout your life, you only saw swans which are white. Based on historical past, you can ‘extrapolate’ your data by induction that all swans are white. This is all jolly well and good until one day you saw your first black swan. This event totally tears away your hypothesis that all swans are white and is something that the past data can never predict. The probability of meeting a black swan is not calculable, though based on the past data it has a very low probability (which explains why you didn’t see one earlier) and has serious consequences. Here, ‘absence of evidence’ is misconstrued as ‘evidence of absence’.

Are we similarly fooled by such logic errors? I can think of a few:

1. From analyzing a company’s past earnings for say 10 years, I come to the conclusion that the earnings are stable and growing steadily. I treat the absence of evidence of ‘poor earning years’ as the evidence of absence of ‘poor earning years’, leading to my skewed over-bullishness of the company.

2. A man, having lived till a ripe age of 100 years old, declares that from his 100 years of non-dying, he is an immortal and thus will carry on living for a few 100 years more. He made a mistake of thinking that ‘no evidence of death’ is the same as the ‘evidence of no death’.

These are exaggerated examples to illustrate the points, but it blows my mind to think in this way.

‘The Black Swan’ carries with this style of writing, perhaps more brilliantly so. The new book talks about how we systemically and biologically ignore black swan events. In fact, he argued that the world is governed mainly by black swan events, not by regular and inconsequential events that are predictable. He goes as far as to say that what we do not know is far more important than what we know. Among the most important things I carried away from reading the book, is this notion of ‘silent evidence’ – how we are blinded by things that are not found in the sample size, hence we discounted them to the extent of skewing our perception of things.

Below is an example to illustrate this point:

Consider the world’s richest people – all of them exhibit traits of risk-taking, go-getter mindset, determined etc etc. Thus,

Rich people have a certain characteristics.
I have these characteristics.
Therefore, I’ll be a rich person.

This is logically flawed. Having a set of characteristics exhibited by rich people does not necessarily mean I’ll be a rich person. There are many examples of people with these characteristics but are not necessarily rich. Hence, these people who had these set of characteristics could be there based on pure luck.

I think these ideas ties in very much with the idea of causality. Correlation does not necessarily imply causality, though causality implies correlation. For example, almost 99.9% of cancer patients drink water (high correlation) but it does not mean that drinking water will cause cancer (no causality). We are often tricked into believing such logic errors, which tend to exacerbate the consequences of black swan events.

------------

The review is split into two parts because the books is exceedingly thick and I had to write down my thoughts halfway before it gets diluted and lost in transition.

This had to be the most the most relevant book I’ve read in my life. It’s like I’ve been born blind, then after a corrective surgery, I see the world as it is now but had been elusive to me before. I can never look at the world again because the book had permanently changed me. Don’t go out and grab the book because I said so…my experiences lead me to different perspectives when I read the book, which will be vastly different from another reader.

The second half of the books talks about more technical stuff. I confess I do not really understand the whole of it in the first reading. Perhaps, like Intelligent investor, the true gist of it will only be realized after subsequent readings. The author highlights the fallacy of treating everyday occurrences to fit the bell-curve (the Standard normal or Gaussian distribution). This fallacy is so rampant that it permeates most of the ‘scientific’ methods regarding a range of socio-economic disciplines like economics, sociology and finance. I’ve never believed in the Modern Portfolio Theory (MPT) and efficient market hypothesis (EMT), so this didn’t struck me hard enough to feel defensive about his ideas.

I guess the author wants us to follow a bottom-up approach rather than a top-down approach in everything. A bottom-up approach means using real, empirical data to look at the world. A top-down approach means learning ‘scientific’ theories and principles, then fitting data that follows them and ignoring or downplaying data that do not.

A simple example would be a stereotypical Western trained doctor who abhor using traditional chinese methods like acupuncture or herbs, judging it unscientific (though it’s very empirically based) because of top-down approach.

Am I also blinded by my own theoretical framework?

The author suggests a few ways to deal with the uncertain world:

1. Make a distinction between positive black swans and negative black swans. Black swans events can benefit or cripple. Once identified, expose yourself maximally from positive black swans, and limit exposure to negative ones

2. Invest in preparedness, not in prediction

3. Seize any opportunity, even those that looks like opportunity. This is the same as exposing one to positive black swans. Work hard, not in grunt work, but in maximizing one’s exposure to opportunities.

4. When caught between unknown probabilities of choices presented to you, focus on the (known) consequences of each choice and not on the probabilities. It’s also known as Pascal’s Wager.

I started this book being blind, and I finished this book knowing that I will never view the world the same again.